Rerun is built to be fast, but sometimes it falls short. This guide is here to help you diagnose performance problems in the Viewer and during live streaming.
Show performance metrics
Start by opening the settings (Cmd/Ctrl + ,) and enabling "Show performance metrics".
This adds the following to the top bar of the Viewer:
- the RAM used by the Viewer
- the CPU time the Viewer spends per frame, in milliseconds
- the frame rate, in frames per second
- the end-to-end latency of any live data
- the round-trip time to any Rerun server you are browsing (missing from the screenshot below)
Hover any of them for details. The numbers only tell you that something is slow, so the rest of this page is about finding out why.

Built-in profiler
The native Viewer, the SDK, and the command-line tools are instrumented with puffin scopes.
In the web viewer, use the browser's own flame graph instead.
Save a trace to a file
To capture a profile, open the command palette (Cmd/Ctrl + P) and pick "Capture profile trace…".
This records five frames and asks you where to save them as a .puffin file.
Attach that file to a bug report, or open it later with puffin_viewer.
Profile a running Viewer
To view the live flame graph of a running Rerun Viewer, first install the puffin_viewer tool:
cargo install puffin_viewer --lockedNext, pick "Open profiler" in the Rerun command palette, or press Ctrl + Shift + P.
To profile the Viewer's own startup, start it with rerun --profile instead.
In the puffin viewer, each frame of the Rerun Viewer is one bar in the top graph.
Click a slow frame to freeze it, then read the flame graph below.
Scopes named [WAIT] mean that the thread is blocked waiting for another thread, so the real work is somewhere else.
Profile the SDK instead
If the latency breakdown points at the SDK rather than the Viewer, profile your own process.
For Python, set RERUN_PUFFIN=1 before importing rerun, and the SDK spawns a puffin_viewer for you.
For Rust, enable the server feature of re_tracing and call re_tracing::Profiler::default().start().
Memory
Slowness is often a memory problem in disguise.
The "Memory flamegraph", "Memory plot", and "Recordings" tabs of the developer panel (Ctrl + Shift + M) break down the Viewer's RAM use per recording and per subsystem.
Clicking the RAM number in the top bar takes you straight to the flame graph.
See limiting memory use for how to cap it.
Latency indicator
Even though Rerun is not meant for teleoperation, having low latency when looking at live data is nice.
Latency can come from many sources.
To figure out the bottleneck in your application, open the developer panel (via the command palette, or by hitting Ctrl + Shift + M) and pick the "Latency" tab.
You can also just click the latency indicator in the top bar, which is always shown when performance metrics are enabled, and otherwise appears on its own when the latency goes above one second.
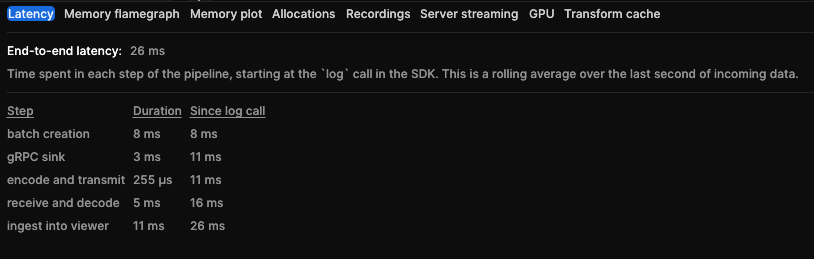
The measurement starts at the log call in your SDK, and each step ends when:
| Step | Ends when |
|---|---|
batch creation | The SDK's background batcher closes the chunk that holds your data. |
gRPC sink | The chunk reaches the gRPC sink in the SDK. |
encode and transmit | The chunk is encoded as Arrow IPC and handed to the network. |
receive and decode | The Viewer has received the bytes and decoded them. |
ingest into viewer | The chunk is in the Viewer's chunk store, ready to be shown. |
The "Duration" column is the time spent since the previous step, so you can see which hop dominates, and "Since log call" is the running total. All values are a rolling average over the last second of incoming data.
Caveats
- Only live data has a latency.
- The measurement is clock-based.
If the SDK and the Viewer run on different machines, any clock skew between them is added to the total.
Steps that appear to happen before the
logcall are dropped, so a skewed clock also makes rows go missing from the breakdown. - The last step is bounded by the frame rate of the Viewer. The Viewer ingests data as part of its update loop, so a Viewer running at 10 FPS adds up to 100 ms of latency, no matter how fast your network is.
What to do about it
| Dominant step | What to try |
|---|---|
batch creation | Lower the micro-batching flush thresholds, in particular RERUN_FLUSH_TICK_SECS |
gRPC sink, encode and transmit | Increase the batch sizes for larger chunks and less overhead |
receive and decode | Send less data, for instance by compressing images |
ingest into viewer | The Viewer is the bottleneck: hide all views to check whether it is the rendering that is slowing down ingestion |