This section explains the process by which logged data is used to produce a visualization and how it can be customized via the user interface or code.
How are visualizations produced?

In the Rerun Viewer, visualizations happen within views, which are defined by their blueprint.
The first step for a view to display its content is to determine which entities are involved. This is determined by the entity query, which is part of the view blueprint. The query is run against the data store to generate the list of view entities.
Views rely on visualizers to display each of their entities.
For example, 3D views use the Points3D visualizer to display 3D point clouds,
and time series views use the SeriesLines visualizer to display time series line plots.
Which visualizers are available is highly dependent on the specific kind of view.
For example, the SeriesLines visualizer only exists for time series views — not, e.g., for 3D views.
For a given view, each entity's components determine which visualizers are available.
By default, visualizers are selected for entities logged with a corresponding archetype.
For example, in a 3D view, an entity logged with the Points3D archetype results in the Points3D visualizer being selected by default.
This happens because the components of an archetype are tagged with the archetype's name.
With a few exceptions, archetypes are directly associated with a single visualizer, but it's also possible to add multiple visualizers of the same type to a given entity via blueprints or the UI.
Then, each selected visualizer determines the values for the components it supports. For example, the Points3D visualizer handles, among others, the Position3D, Radius, and Color components.
Sometimes it makes sense to explicitly set the visualizers, to change the way entities are visualized.
Here is how to force a SeriesPoints visualizer for /trig/sin, in addition to the default SeriesLines visualizer:
"""Log a scalar over time and override the visualizer."""

from math import cos, sin, tau

import rerun as rr
import rerun.blueprint as rrb

rr.init("rerun_example_series_line_overrides", spawn=True)

# Log the data on a timeline called "step".
for t in range(int(tau * 2 * 10.0)):
    rr.set_time("step", sequence=t)

    rr.log("trig/sin", rr.Scalars(sin(float(t) / 10.0)))
    rr.log("trig/cos", rr.Scalars(cos(float(t) / 10.0)))

# Use the SeriesPoints visualizer for the sin series.
rr.send_blueprint(
    rrb.TimeSeriesView(
        overrides={
            "trig/sin": [rr.SeriesLines(), rr.SeriesPoints()],
        },
    ),
)
The view now displays a series of points in addition to connecting the values with lines. Here is how the visualizers are displayed in the user interface:

The next section describes how to precisely control what data each visualizer operates on, to fully customize the contents of a view.
Component mappings
Each visualizer takes various components as input. Values are automatically sourced from the data store. When no matching data exists (except for required components like point cloud positions or plot scalars), the Viewer generates sensible default values. The exact way this is done depends on the type of View, but may be influenced by a variety of circumstances.
Component mappings let you customize this behavior, for example to:
- Control what data is picked from the store - this allows you to visualize arbitrary data, even when it was not logged with Rerun-semantics.
- Specify the styling of a visualization as part of your blueprint
Component mappings can be modified via the Viewer UI by navigating to a visualizer and expanding the component of interest.
Custom values
A common way of customizing a visualization is by setting custom values, for example for visualizers that expect a Color component.
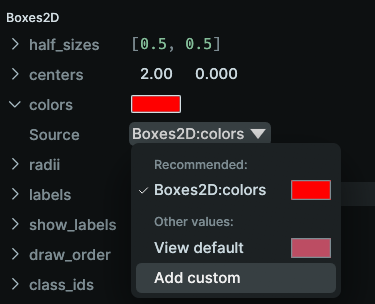
In the UI this can be done via the visualizer UI, by clicking and modifying the color component, or by selecting "Add custom…" from the Source dropdown.
When such a customization is defined, it automatically changes the component's source for this visualizer to point to this new custom value.
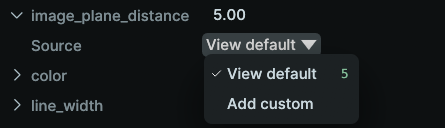
The Source dropdown menu allows quick toggling between the different input representations. By clicking on "Add custom…" you can create a new custom component override:
You then can use the color picker to determine a color:

Note that any direct edit on any component of the visualizer will always set the source to "Custom".
The following snippet shows how the same customization can be achieved with the blueprint API:
"""Override a component."""

import rerun as rr
import rerun.blueprint as rrb

rr.init("rerun_example_component_override", spawn=True)

# Data logged to the data store.
rr.log("boxes/1", rr.Boxes2D(centers=[0, 0], sizes=[1, 1], colors=[255, 0, 0]))
rr.log("boxes/2", rr.Boxes2D(centers=[2, 0], sizes=[1, 1], colors=[255, 0, 0]))

rr.send_blueprint(
    rrb.Spatial2DView(
        # Override the values from the data store for the first box.
        overrides={
            "boxes/1": rr.Boxes2D(colors=[0, 255, 0]),
        },
    ),
)
Remapping of components
A powerful mechanism that is built into visualizers is the option to source components from data that was logged on the same entity but might have arbitrary semantics.
Within a view, a visualizer can pick up any component that has the same datatype as the builtin type that it expects.
For example, the SeriesLines and SeriesPoints visualizers can pick up any numerical data for their Scalar component.
The same holds for String-like components that can be selected for Name.
Likewise, the state timeline view's visualizer can source its StateChange:state input from any string, boolean, or numeric component (see Visualize state changes).
Such data often comes from MCAP data that has user-defined message types, or from components that were flexibly logged via AnyValues or DynamicArchetype.
The Viewer can even look for data with compatible datatypes in nested fields of Arrow StructArrays.
Suitable components show up in the source dropdown:

#12661: Currently, only the time series view (scalars) and the state timeline view (state values) allow remapping of required components. All other visualizers require matching Rerun semantics (correct archetype & type metadata) for their required fields.
As always, component mappings can be set via the blueprint APIs:
# Green cosine:
# * source scalars from the custom component
#   "custom:my_custom_scalar"
# * set the name via an override
# * everything else uses the automatic component mappings,
#   so it will pick up colors from the view default.
rr.SeriesLines(names="cosine (custom)").visualizer(
    mappings=[
        # Map scalars to the custom component.
        VisualizerComponentMapping(
            target="Scalars:scalars",
            source_kind=ComponentSourceKind.SourceComponent,
            # Map from custom component
            source_component="custom:my_custom_scalar",
        ),
    ]
),
To select nested fields in StructArrays, Rerun uses so-called selectors, which are filters that are inspired by jq, a tool for processing JSON data.
Per-view component default
The viewer picks default component values based on a wide variety of different heuristics, ranging from simple local properties like an entity's name all the way to things like the size of a view's bounding box or how many plots are within it.
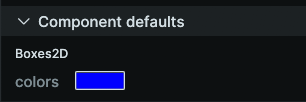
Sometimes, it makes sense to set a custom default value that is applied across all visualizers of a view, to avoid redundant blueprint definitions.
This can be done through the UI by selecting the view in question and specifying a new default there:

A custom default value set this way will show up on the respective visualizers:
This is how it is achieved with the blueprint API:
"""Add a component default."""

import rerun as rr
import rerun.blueprint as rrb

rr.init("rerun_example_component_override", spawn=True)

# Data logged to the data store.
rr.log("boxes/1", rr.Boxes2D(centers=[0, 0], sizes=[1, 1], colors=[255, 0, 0]))
rr.log("boxes/2", rr.Boxes2D(centers=[2, 0], sizes=[1, 1]))

rr.send_blueprint(
    rrb.Spatial2DView(
        overrides={"boxes/1": rr.Boxes2D(colors=[0, 255, 0])},
        # Add a default value for all Color components in this view
        defaults=[rr.Boxes2D.from_fields(colors=[0, 0, 255])],
    ),
)
Here, the /boxes/2 entity is no longer logged with a color value, but a default box color is added to the blueprint. Here is how the user interface represents its visualizer:
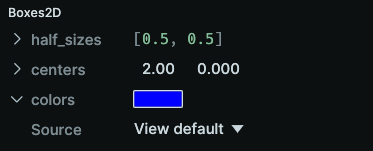
And as before, this also shows up in the View's component defaults.