A Chunk is the core datastructure at the heart of Rerun: it dictates how data gets logged, injected, stored, and queried. A basic understanding of chunks is important in order to understand why and how Rerun and its APIs work the way they work.
How Rerun stores data
All the data you send into Rerun is stored in chunks, always.
A chunk is an Arrow-encoded, column-oriented table of binary data:

A Component Column contains one or more Component Batches, which in turn contain one or more instances (that is, a component is always an array). Each component batch corresponds to a single Row ID and one time point per timeline.
This design allows for keeping chunks within a target size range, even for recordings that combine low frequency but large data like point clouds or tensors (wide columns), with high frequency but small signals (tall columns).

Here's an excerpt from a real-world chunk (taken from the Helix example) (you might want to open this image in a new tab):
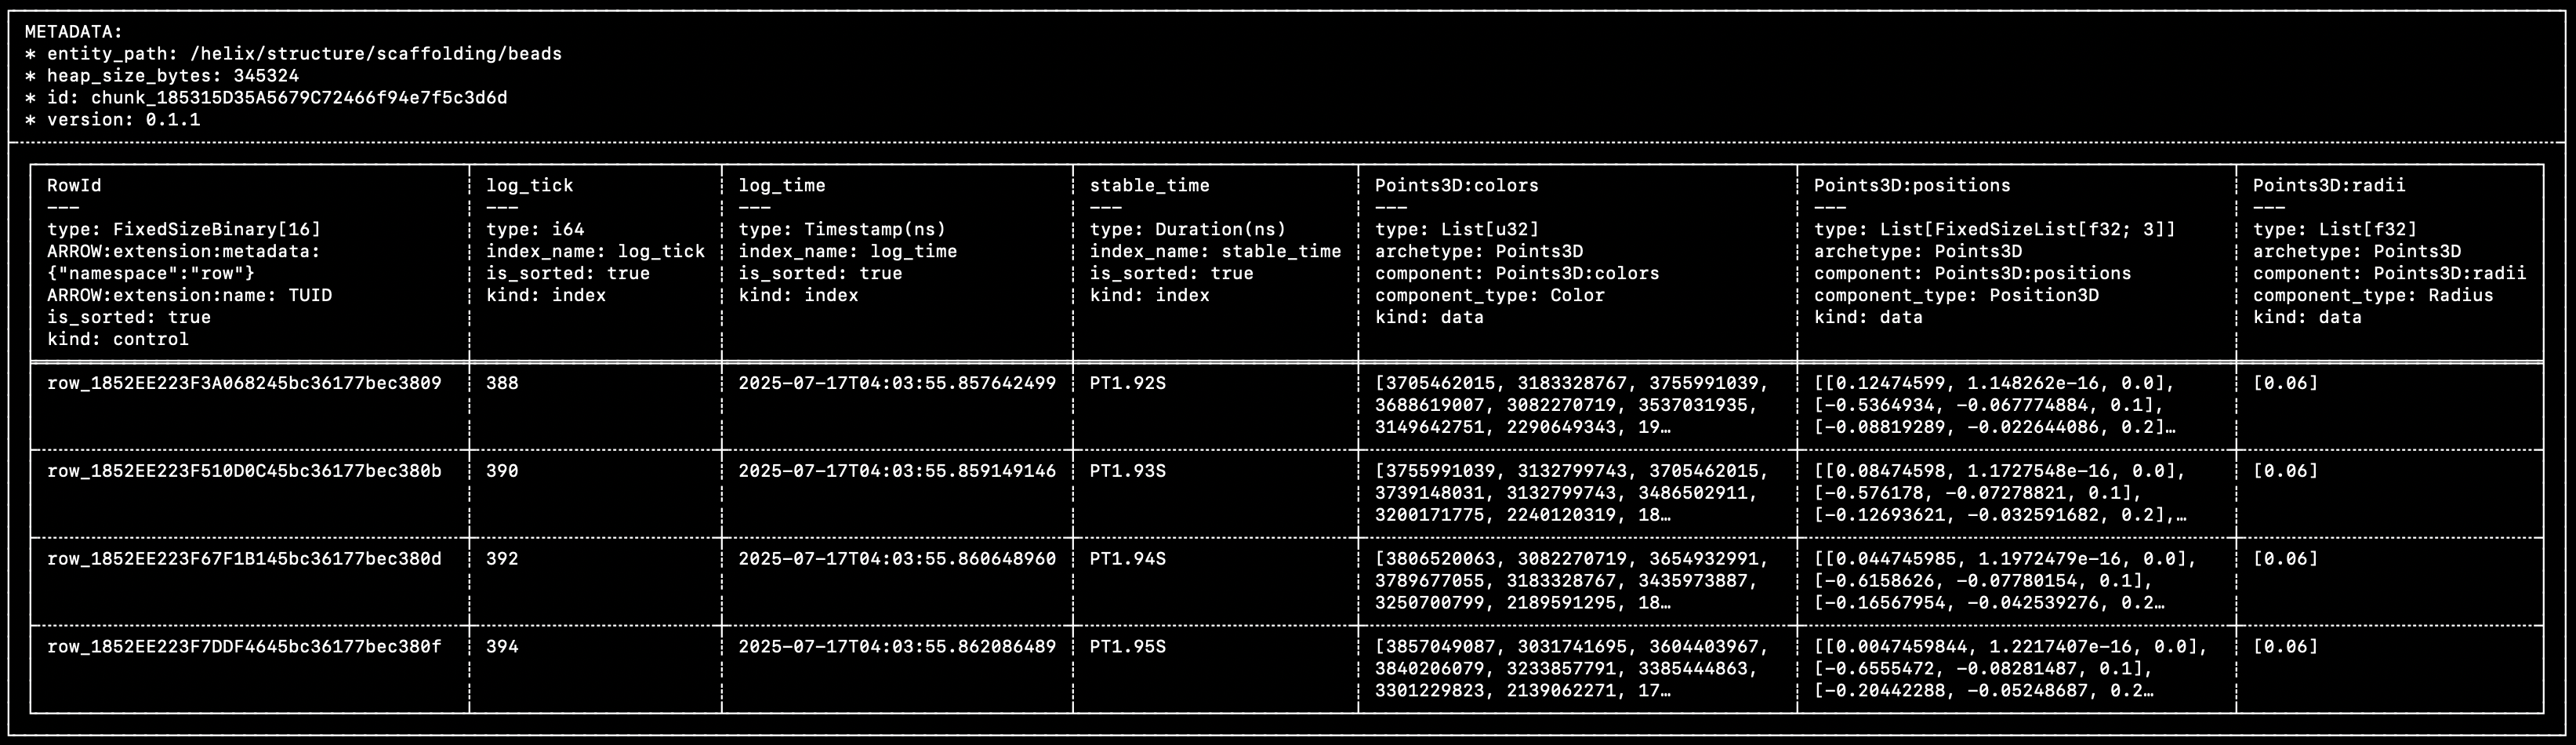

You can see that this matches very closely the diagram above:
- A single control column, that contains the unique row IDs.
- Multiple time/index columns (
log_tick,log_time,stable_time). - Multiple component columns (
Points3D:colors,Points3D:positions,Points3D:radii).
Within each row of each component column, the individual cells are Component Batches. Component batches are the atomic unit of data in Rerun.
The data in this specific chunk was logged with the following code:
rr.set_time("stable_time", duration=time)

beads = [bounce_lerp(points1[n], points2[n], times[n]) for n in range(NUM_POINTS)]
colors = [[int(bounce_lerp(80, 230, times[n] * 2))] for n in range(NUM_POINTS)]
rr.log(
    "helix/structure/scaffolding/beads",
    rr.Points3D(beads, radii=0.06, colors=np.repeat(colors, 3, axis=-1))
)
You can learn more about chunks and how they came to be in this blog post.
Getting chunks into Rerun
If you've used the Rerun SDK before, you know it doesn't actually force you to craft these chunks manually, which would be rather cumbersome!
How does one create and store chunks in Rerun, then?
The row-oriented logging: log
The log API is generally what we show in the getting-started guides since it's the easiest to use:
"""
Update a scalar over time.

See also the `scalar_column_updates` example, which achieves the same
thing in a single operation.
"""

from __future__ import annotations

import math

import rerun as rr

rr.init("rerun_example_scalar_row_updates", spawn=True)

for step in range(64):
    rr.set_time("step", sequence=step)
    rr.log("scalars", rr.Scalars(math.sin(step / 10.0)))
The log API makes it possible to send data into Rerun on a row-by-row basis, without requiring any extra effort.
This row-oriented interface makes it very easy to integrate into existing codebase and just start logging data as it comes (hence the name).
Reference:
But if you're handing a bunch of rows of data over to Rerun, how does it end up neatly packaged in columnar chunks?
How are these rows turned into columns?
Before logging data, you can use the rr.set_time_ APIs to update the SDK's time context with timestamps for custom timelines.
For example, rr.set_time("frame", sequence=42) will set the "frame" timeline's current value to 42 in the time context.
When you later call rr.log, the SDK will generate a row id and a value for the built-in log_time timeline (enabled by default), as well as log_tick if you have opted in to it.
It will also grab the current values for any custom timelines from the time context.
Any data passed to rr.log or rr.log_components becomes component batches.

The row id, timestamps, and logged component batches are then encoded as Apache Arrow arrays and together make up a row. That row is then passed to a batcher, which appends the values from the row to the current chunk for the entity path.

The current chunk is then sent to its destination, either periodically or as soon as it crosses a size threshold. Building up small column chunks before sending from the SDK trades off a small amount of latency and memory use in favor of more efficient transfer and ingestion. You can read about how to configure the batcher here.
The column-oriented logging: send_columns
The log API showcased above is designed to extract data from your running code as it's being generated. It is, by nature, row-oriented.
If you already have data stored in something more column-oriented, it can be both a lot easier and more efficient to send it to Rerun in that form directly.
This is what the send_columns API is for: it lets you efficiently update the state of an entity over time, sending data for multiple index and component columns in a single operation.
"""
Update a scalar over time, in a single operation.

This is semantically equivalent to the `scalar_row_updates` example,
albeit much faster.
"""

from __future__ import annotations

import numpy as np

import rerun as rr

rr.init("rerun_example_scalar_column_updates", spawn=True)

times = np.arange(0, 64)
scalars = np.sin(times / 10.0)

rr.send_columns(
    "scalars",
    indexes=[rr.TimeColumn("step", sequence=times)],
    columns=rr.Scalars.columns(scalars=scalars),
)
Reference:
Sending actual chunks: send_chunks
The Chunk data structure described above is also exposed as a Python class.
You can build a chunk from, e.g., time/component columns, inspect or transform existing chunks, and forward chunks to a recording stream with send_chunks:
"""Build a `Chunk` with `Chunk.from_columns` and send it via `send_chunks`."""

from __future__ import annotations

import rerun as rr
import rerun.experimental as rrx

rr.init("rerun_example_build_chunk")

chunk = rrx.Chunk.from_columns(
    "/points",
    indexes=[rr.TimeColumn("frame", sequence=[0, 1, 2])],
    columns=rr.Points3D.columns(
        positions=[[1, 0, 0], [0, 1, 0], [0, 0, 1]],
        radii=[0.1, 0.2, 0.3],
    ),
)

# Chunks can be inspected in many ways, including a text representation of
# its content
print(chunk)

rrx.send_chunks(chunk)
Alternatively, chunks can be created from an existing Arrow RecordBatch using Chunk.from_record_batch:
# Create an index column.
frame = pa.array([0, 1, 2], type=pa.int64())

# Create two component columns.
positions_datatype = pa.list_(
    pa.list_(pa.field("item", pa.float32(), nullable=False), 3)
)
left = pa.array(
    [[[1.0, 0.0, 0.0]], [[2.0, 0.0, 0.0]], [[3.0, 0.0, 0.0]]],
    type=positions_datatype,
)
right = pa.array(
    [[[0.0, 1.0, 0.0]], [[0.0, 2.0, 0.0]], [[0.0, 3.0, 0.0]]],
    type=positions_datatype,
)

# The `/entity:Archetype:component` column-name convention tells
# `from_record_batch` which entity and component each column maps to.
batch = pa.RecordBatch.from_arrays(
    [frame, left, right],
    names=["frame", "/left:Points3D:positions", "/right:Points3D:positions"],
)

chunks = rrx.Chunk.from_record_batch(batch, index="frame")

for chunk in chunks:
    print(chunk)
send_chunks also accepts iterables of chunks, as well as instances of LazyChunkStream, ChunkStore, and LazyStore.
For example, to forward every chunk of an existing RRD into a new recording stream:
"""Send chunks loaded from an RRD into a recording stream."""

import sys

import rerun as rr
import rerun.experimental as rrx

path_to_rrd = sys.argv[1]

# NOTE: This is specifically demonstrating how to forward chunks from an RRD
# into the viewer.
# If you just want to view an RRD file, use the simpler `rr.log_file()`
# function instead:
#   rr.log_file("path/to/file.rrd", spawn=True)

reader = rrx.RrdReader(path_to_rrd)
entry = reader.recordings()[0]

rr.init(entry.application_id, recording_id=entry.recording_id, spawn=True)
rrx.send_chunks(reader.store())
Like send_columns, this path bypasses the time context and the micro-batcher: chunks are forwarded as-is, with whatever timelines they were built with.
See the Chunk Processing API for building ingestion, transformation, and conversion pipelines out of these primitives.
Reference:
Dataframe logging: Chunk.from_dataframe and send_dataframe
rr.send_dataframe and the related Chunk.from_dataframe extend the single record batch equivalent and accept a full PyArrow Table (or a RecordBatchReader, or any Arrow-C-stream object such as a datafusion.DataFrame) carrying any number of entities, and yields the chunks of each record batch in turn.
To map columns of the dataframe to Rerun timelines and components, the dataframe must carry the same rerun:* metadata as above.
For example, here we hand-craft a dataframe containing a Points3D entity:
# An index column…
index = pa.array([0, 1, 2], type=pa.int64())

# …and a component column. Each row is a list (one component batch per row).
positions = pa.array(
    [
        [[1.0, 0.0, 0.0]],
        [[0.0, 1.0, 0.0]],
        [[0.0, 0.0, 1.0]],
    ],
    type=pa.list_(pa.list_(pa.field("item", pa.float32(), nullable=False), 3)),
)

# Tag each column with the `rerun:*` metadata keys that `Chunk.from_dataframe`
# recognizes.
schema = pa.schema([
    pa.field(
        "frame",
        index.type,
        metadata={b"rerun:index_name": b"frame", b"rerun:kind": b"index"},
    ),
    pa.field(
        "/points:Points3D:positions",
        positions.type,
        metadata={
            b"rerun:entity_path": b"/points",
            b"rerun:archetype": b"rerun.archetypes.Points3D",
            b"rerun:component": b"Points3D:positions",
            b"rerun:component_type": b"rerun.components.Position3D",
            b"rerun:kind": b"data",
        },
    ),
])

table = pa.Table.from_arrays([index, positions], schema=schema)
Chunk.from_dataframe then interprets that metadata and yields one chunk per entity path:
chunks = list(rrx.Chunk.from_dataframe(table))
for chunk in chunks:
    print(chunk)
rr.send_dataframe is a thin logging convenience wrapper over Chunk.from_dataframe: it builds those same chunks and forwards them to the active recording stream in one call.
rr.send_dataframe(table)Like send_columns, it bypasses the time context and the micro-batcher — only timelines explicitly present in the table are added.
Manually crafting the required metadata is obviously inconvenient. This API is instead designed to compose with dataframe queries, which produce dataframes already populated with metadata derived from the originally queried data.
Reference: