How we sped up time series by 20-30x
This is a follow up post to the post Real-time kHz time series in a multimodal visualizer that dives into how we managed to achieve such huge performance gains for time series (among other things), and why it was so hard in the first place.
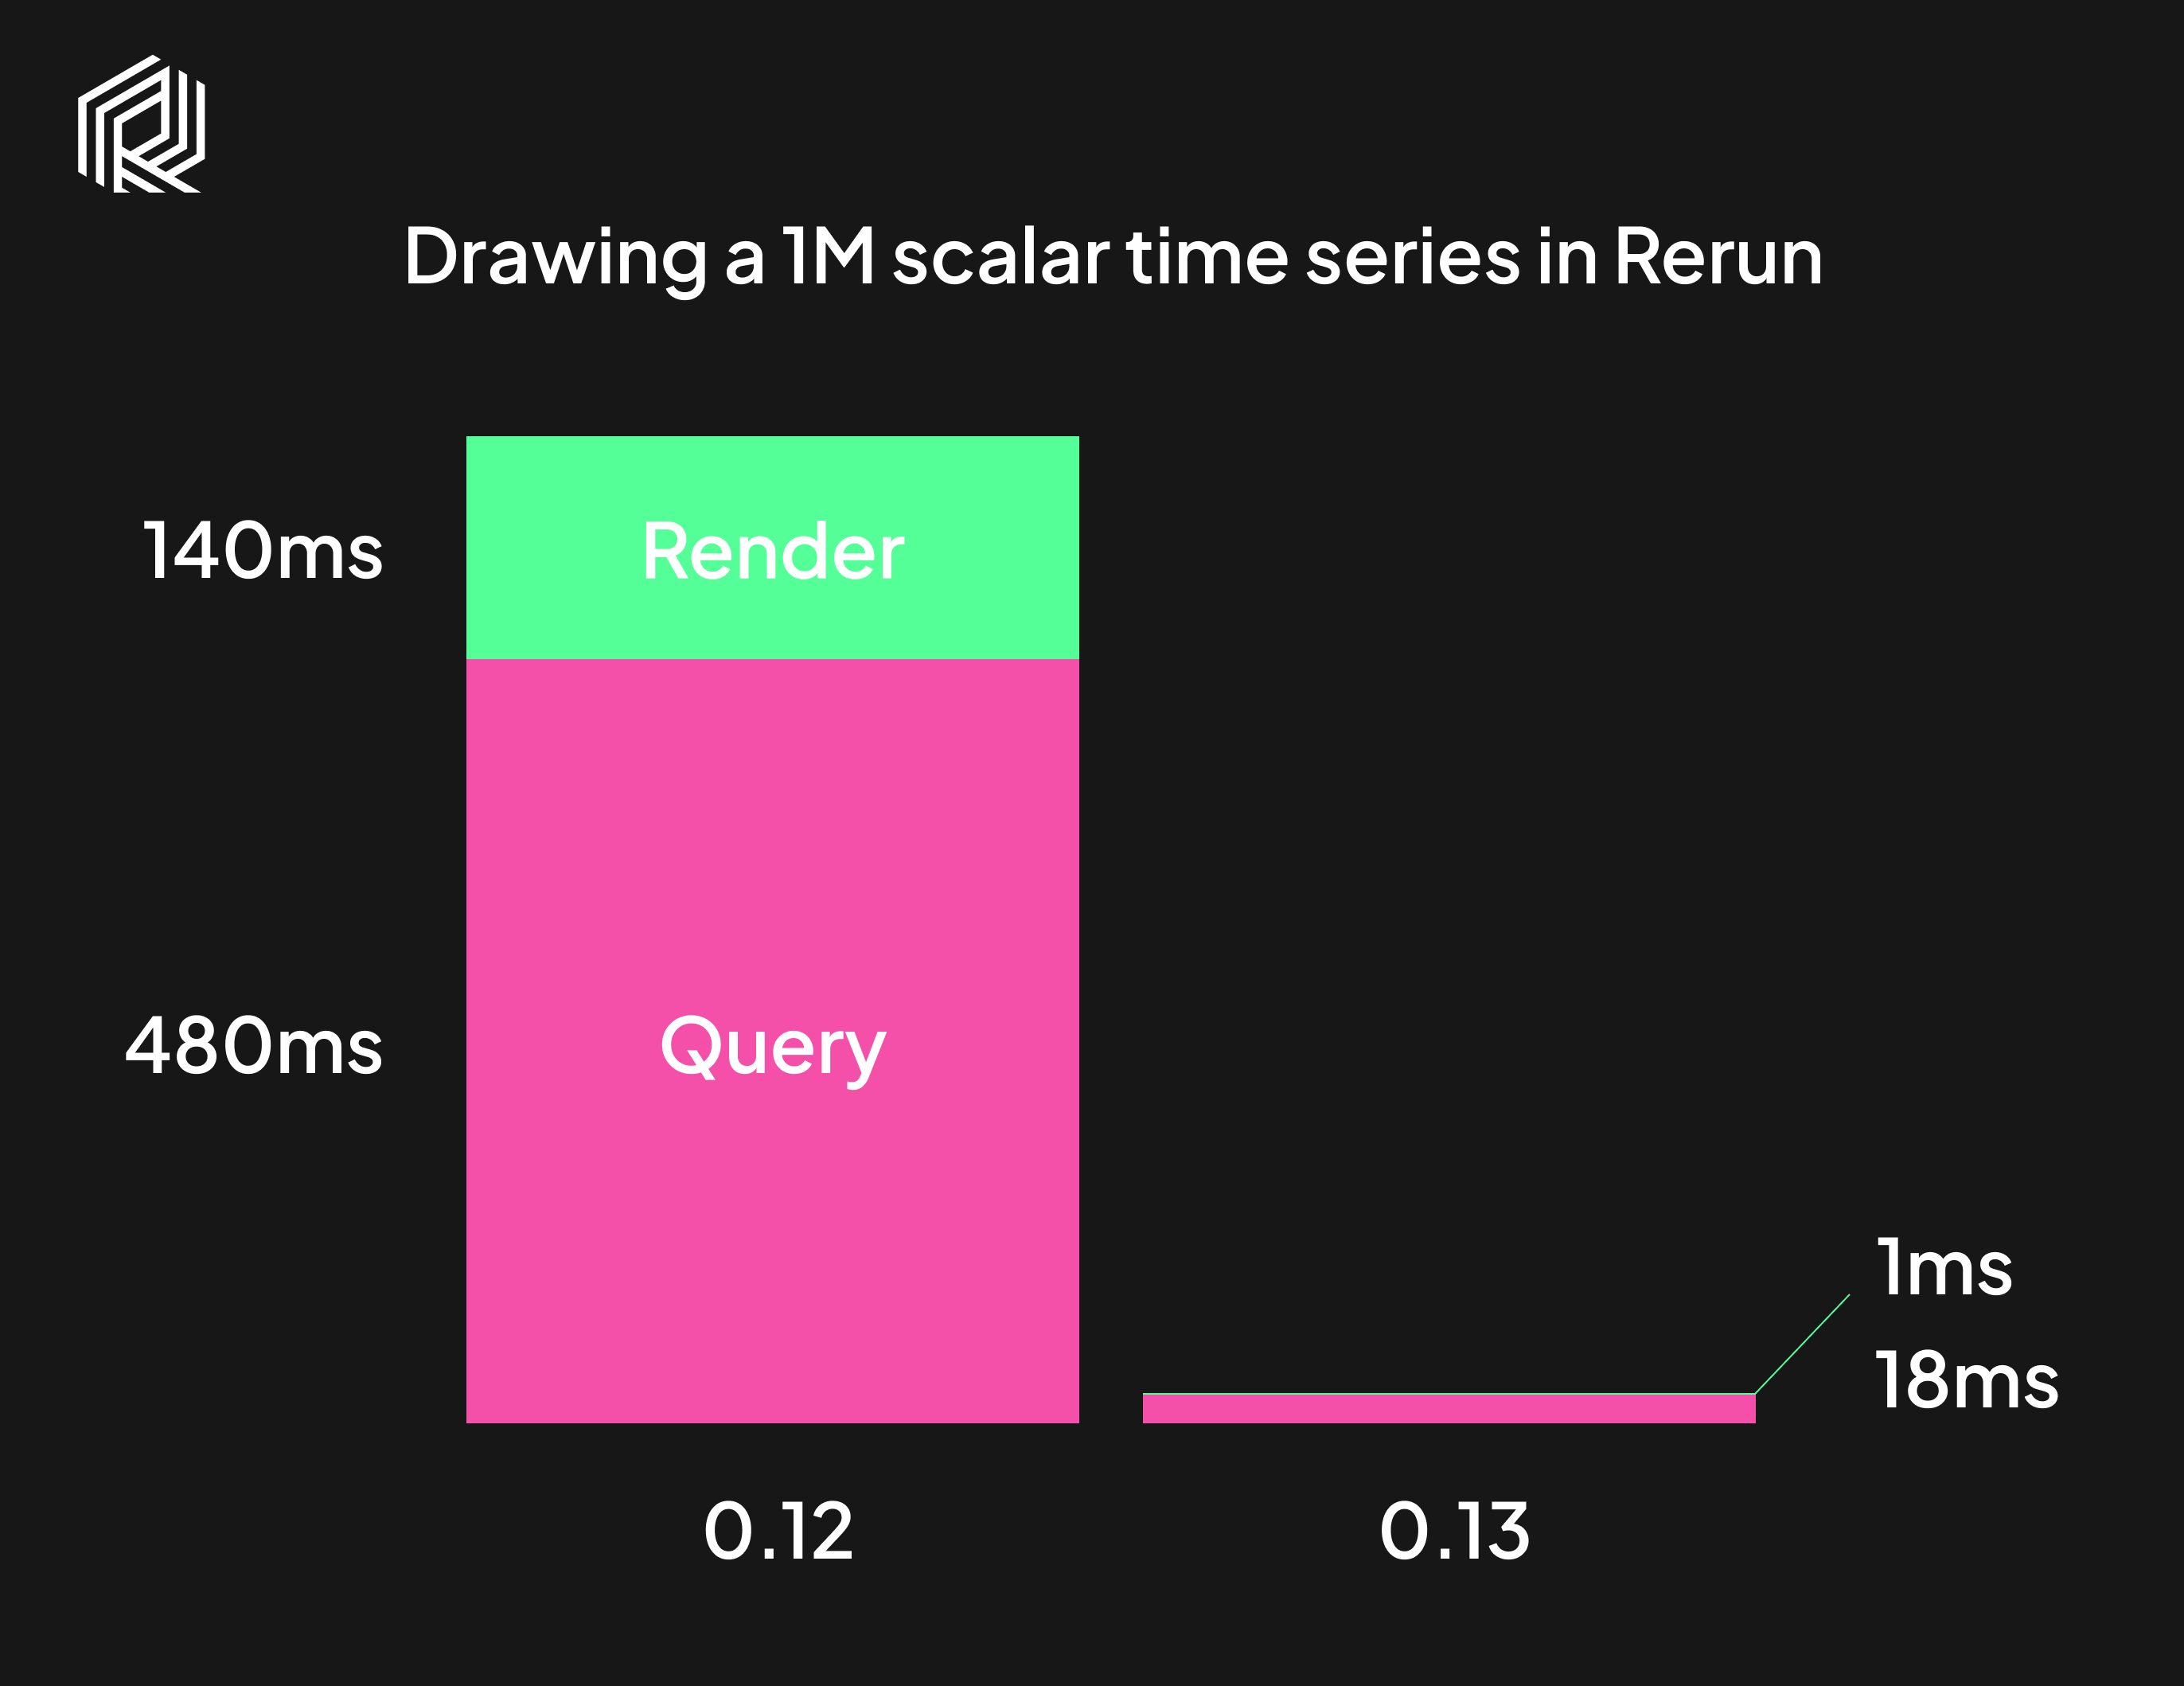
Comparison of time taken to draw a time series plot in Rerun with 1M points between version 0.12 and 0.13. The numbers come from profiling on a 2021 M1 MacBook Pro.
Flexible multimodal data is hard to combine with fast plots
Ever since the first release of Rerun, plotting larger time series has been painfully slow. 0.13 is the first release where we think they're actually usable. It’s worth taking a step back to explain why making plots fast in Rerun was hard, before getting into what we did about it. To do that, we need some more background on how Rerun, the in-memory database, works.
Rerun as a multimodal time series database
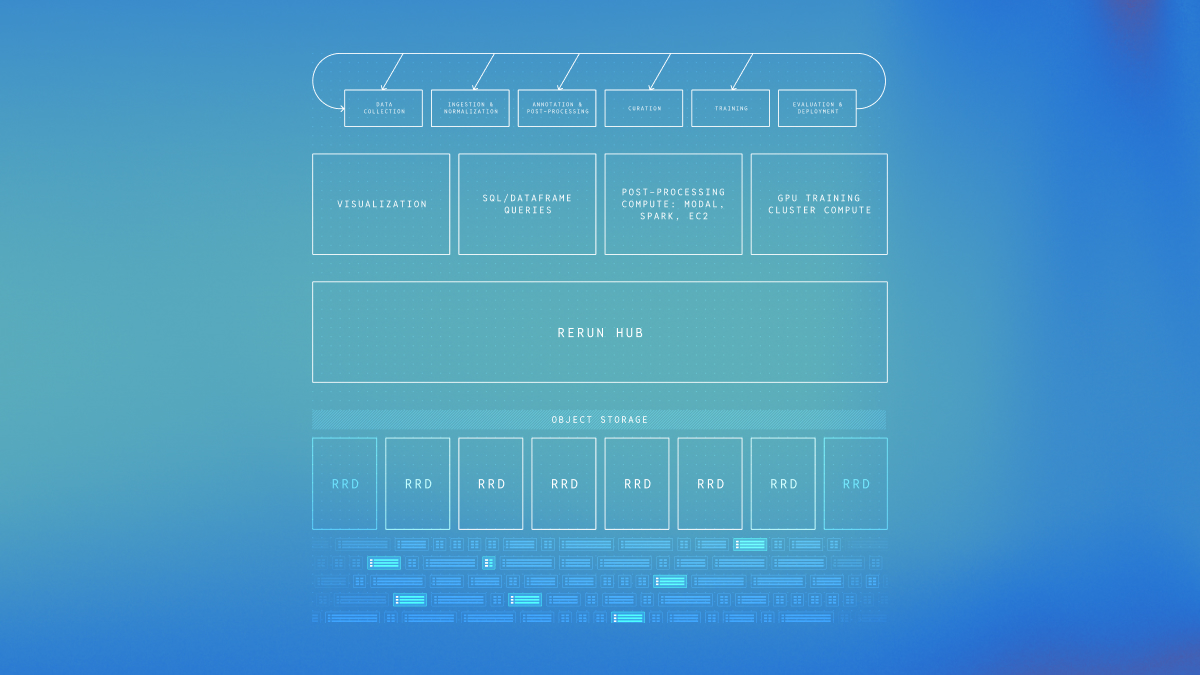
One way of looking at Rerun is as an in-memory multimodal time series database with visualization on top.
- You can throw many kinds of data at it, from simple metrics to big multi dimensional tensors, point clouds, and text documents.
- Data is indexed along multiple user defined timelines, and can come in out of order.
- The Rerun data model is a temporal Entity Component System (ECS) that allows updating single components at a time.
Let's look at a small example of updating a colored point cloud in parts and out of order:
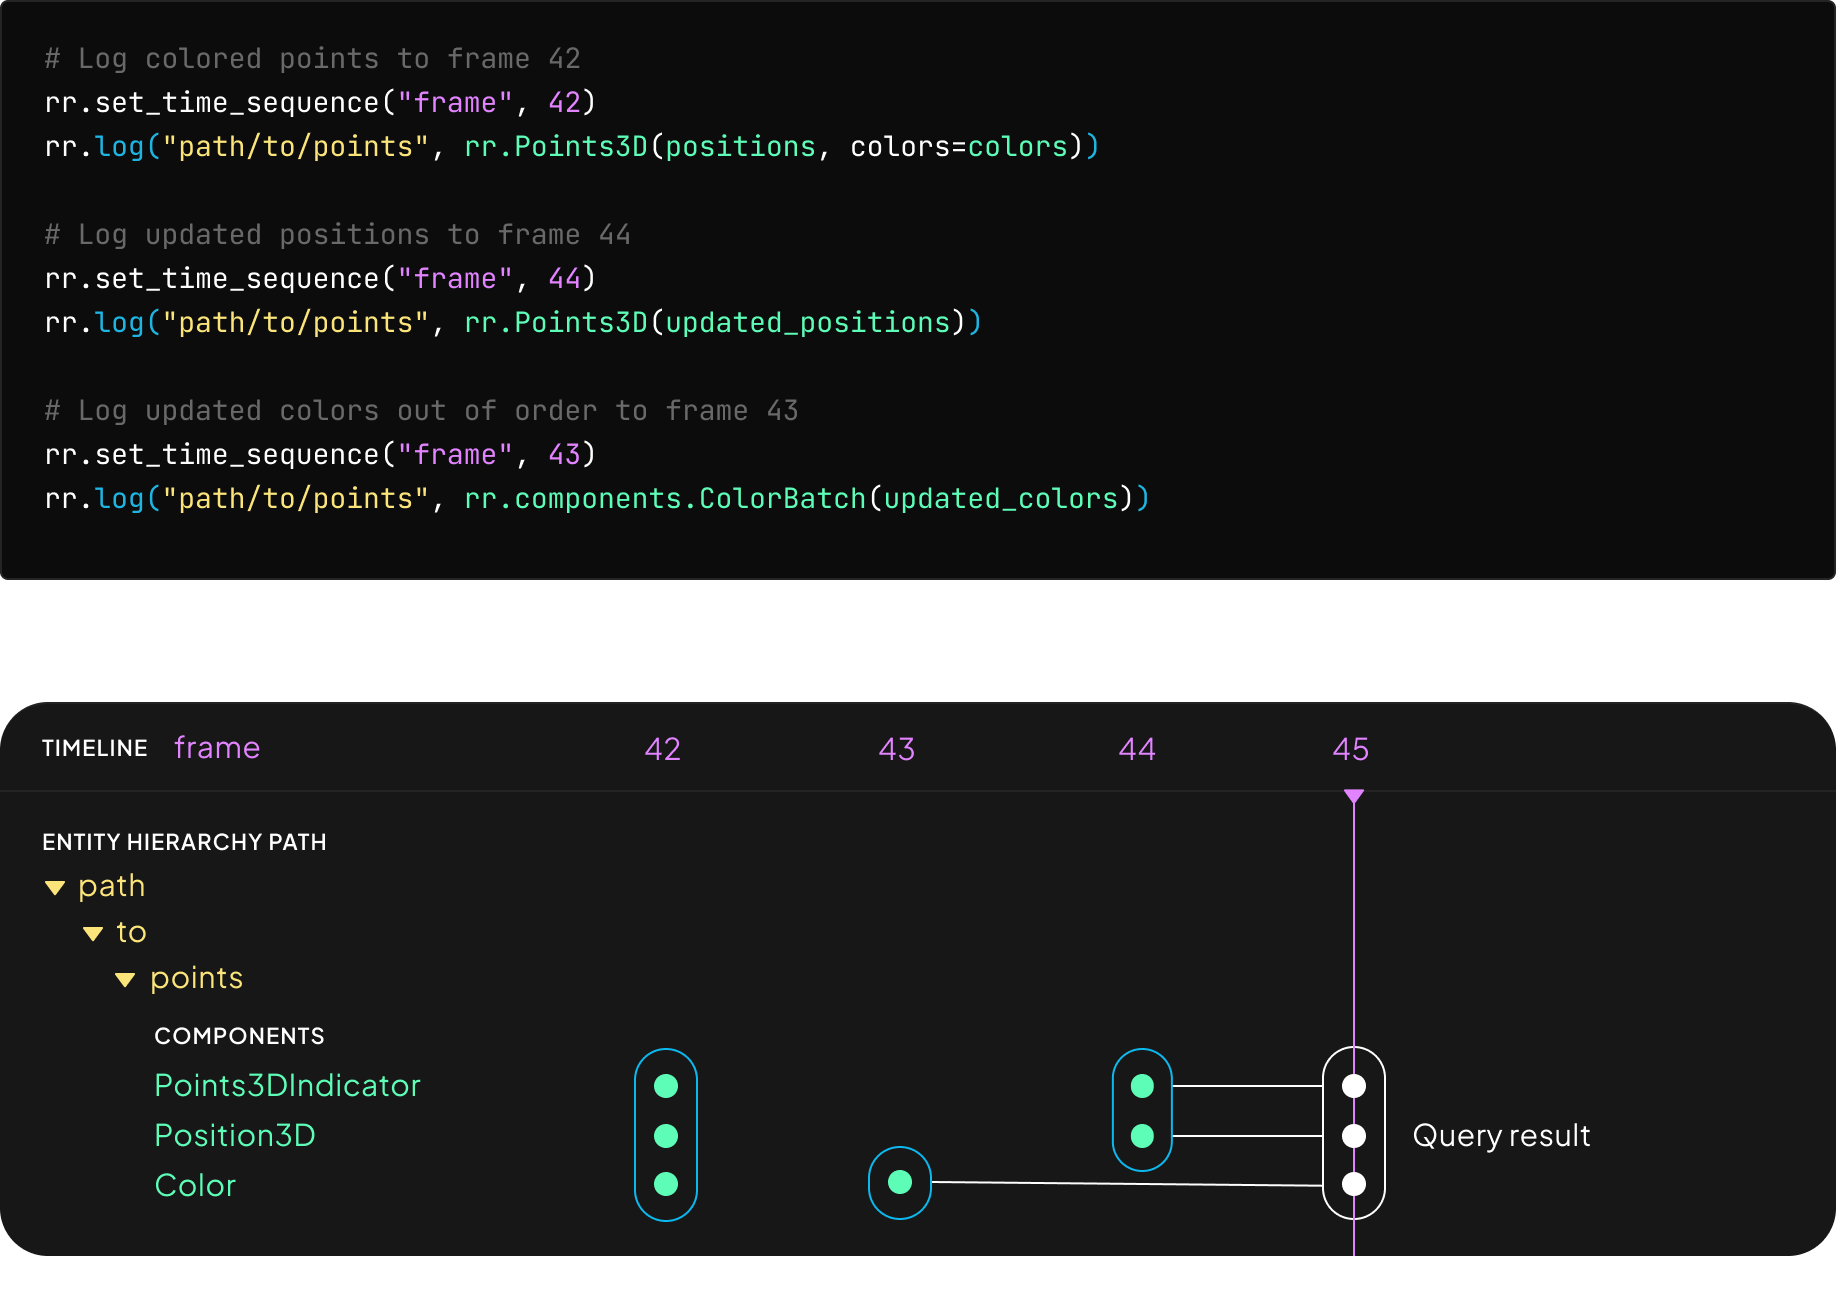
For any given time point, the datastore needs to be able to collect the latest components of any entity, and join them against the primary component (3D positions in this case). Queries run every time Rerun renders a frame, which should be 60 times per second.
Getting all this to be both correct and fast took considerable effort during the first year of Rerun. The combination of all these features is what makes Rerun so versatile and easy to use.
Overhead from flexibility make simple time series the worst case
Flexibility comes at the cost of added overhead. That matters less for larger data, but dominates performance for small data like scalars. In Rerun, time series are created by querying the datastore for all scalars on an entity for a range of time. Before 0.13, the worst case was therefore simple time series plots, since you'd have to pay all that overhead many times for very little data.
Speeding up time series by a factor of 20-30
On Rerun 0.12, rendering a single frame of a 1M point time series plot takes ~600ms on a 2021 M1 MacBook Pro. On 0.13 it takes ~20ms, a 30x speedup. For smaller series the speedup tends to come closer to 20x, which is still huge. How did we get there?
Sources of overhead in time series plots
Let’s sum up the main sources of overhead in producing data for and rendering a time series plot:
- Bookkeeping: Keeping track of which components exist at each timestamp is relatively costly for small data.
- Data locality: For small data, the flexible data model (both in time and data type) bottoms out in a lack of data locality, which is bad for CPU cache efficiency.
- Redundant work: When plotting a moving time window, data is usually only changing at the edges of the window. Repeatedly running the full range query creates lots of redundant work.
- Rendering: For large time series, there may be more points than pixels to draw them on along the time dimension (x-axis). This leads to redundant tessellation and overdraw in the rendering pipeline.
Why we didn't just special case metrics
The easiest solution for speeding up time series plots would be to special case the path for metrics. A specialized code path for simple metrics would make huge gains relatively easy.
Unfortunately this isn’t good enough because our users need good performance for more kinds of range queries. Here is an example using time ranges to show an aggregate point cloud in a structure from motion setting:
In addition, our motivating example for kHz plots was IMU samples, which usually come as messages containing multiple values to plot. That makes special casing the single metrics less useful. For example:
typedef struct {
    float acc[3];

    float gyro[3];  // <- Want to plot these as time series

    unsigned long timestamp;
} IMUSample;
Rerun doesn’t yet support visualizing time series from single fields of larger structs directly, but we will soon and our approach needs to support this as a first class use-case.
Caching is difficult but necessary
There are only two hard things in Computer Science: cache invalidation and naming things.
Phil Karlton
The non-rendering sources of overhead just scream caching, but as usual the devil is in the details, in particular the details of cache invalidation. In our case, out of order insertions combined with composing multiple components over time make invalidation particularly gnarly.
Datastore changelogs make invalidation manageable
Except for garbage collection (dropping old data to free up memory), the Rerun datastore is immutable. Data is always dropped through snapshotting so that query semantics are left unchanged. Every single change results in adding or removing rows to the store.
The first step we took after deciding it was time for caching was a refactor that turned every system that maintains a derived dataset in Rerun (timeline widget, view heuristics engine, etc) into a store subscriber, which listens to changelogs of added or removed rows in the datastore.
Cache invalidation is yet another store subscriber, and having this protocol in place is what made it manageable to deal with all the complexity.
Caches are built lazily at query time
Cache invalidation only sets a dirty flag. Actually building the cache happens lazily at query time. Since Rerun uses an end to end immediate mode architecture, we query the datastore on every frame, ideally 60 times per second.
This acts as a natural micro-batching mechanism where we first accumulate changes while we render the current frame and then handle all these changes at the start of the next frame. Batching updates like this is great for performance.
Visible views query the datastore right before rendering. Building caches lazily therefore means we never spend time updating a cache that isn’t used.
Multi-tenancy requires fine grained locking
When not on the web, each space view (draggable visualization panel) runs and queries the datastore in parallel. Many of these queries might overlap so we need to make sure to share data and cache resources appropriately.
Supporting this multi-tenancy requires fine grained locking on the combination of store (there are multiple), entity, set of components, and the component “point of view” (the component we join against).
Aggregating sub-pixel points speeds up rendering
There are only so many pixels available to draw on along the x-axis. For large time series, that means you need to aggregate points that would show up on the same x-axis tick to avoid overdraw and redundant tessellation in the render pipeline.
We compute these aggregations on every frame and let users choose between a set of basic options.
A caveat on performance for out of order logs
The speedups added in 0.13 slow down ingestion speed for out of order logs. In practice this only matters for scalars logged out of order at high frequency, but it does mean that live time series plots are slow in this case. An update that fixes this is planned for 0.13.1. Follow the progress here.
Huge wins already but there is more to be had
Adding a caching layer to the Rerun datastore has taken lots of effort over the last months, but the performance gains are clearly worth the added complexity.
There are still lots of gains to be had by adding secondary caches on top, for scalars and other data. For example, slowly changing 3D geometry could be cached on the GPU to avoid redundant CPU -> GPU transfers, which are currently the performance bottleneck for point clouds.
Join us on Github or Discord and let us know what if these performance improvement made a difference for you, and what areas you'd love to see us speed up next.