Exploiting column chunks for faster ingestion and lower memory use
At Rerun, we want to help teams unify their visualization and data stacks for multimodal robotics-style data. To enable working with more kinds of datasets in Rerun, the 0.18 release introduces a new column oriented API and performance improvements to help handle larger time-series.
Up to this point Rerun has been designed around the use case of logging multimodal data as it's being produced. For example, this lets you do visual time-travel debugging of robotics and computer vision pipelines by just adding a couple log lines to your code.
Other core use cases of Rerun have been e.g. visualizing outputs of spatial neural nets and building robotics dashboards. At the same time, the community has been pushing to use Rerun for more and more of their visualization tools, including visualizing large pre-recorded time-series.
Rerun's indexing strategy and data format was originally optimized for recordings of mostly large pieces of data (point clouds, tensors, etc), and few time points (<100k). While the viewer could handle scalar time-series in the kHz range, ingestion and memory overhead scaled poorly with long time-series. Sending arrays of time-series to Rerun was also clunky and inefficient since you had to loop over your series and log it one scalar at a time.
In Rerun 0.18 these problems are largely fixed. For an illustrative benchmark, we have a dataset of 9 plots of 5 series each, with 50k f64 scalars per series (i.e. 2.25M points total).
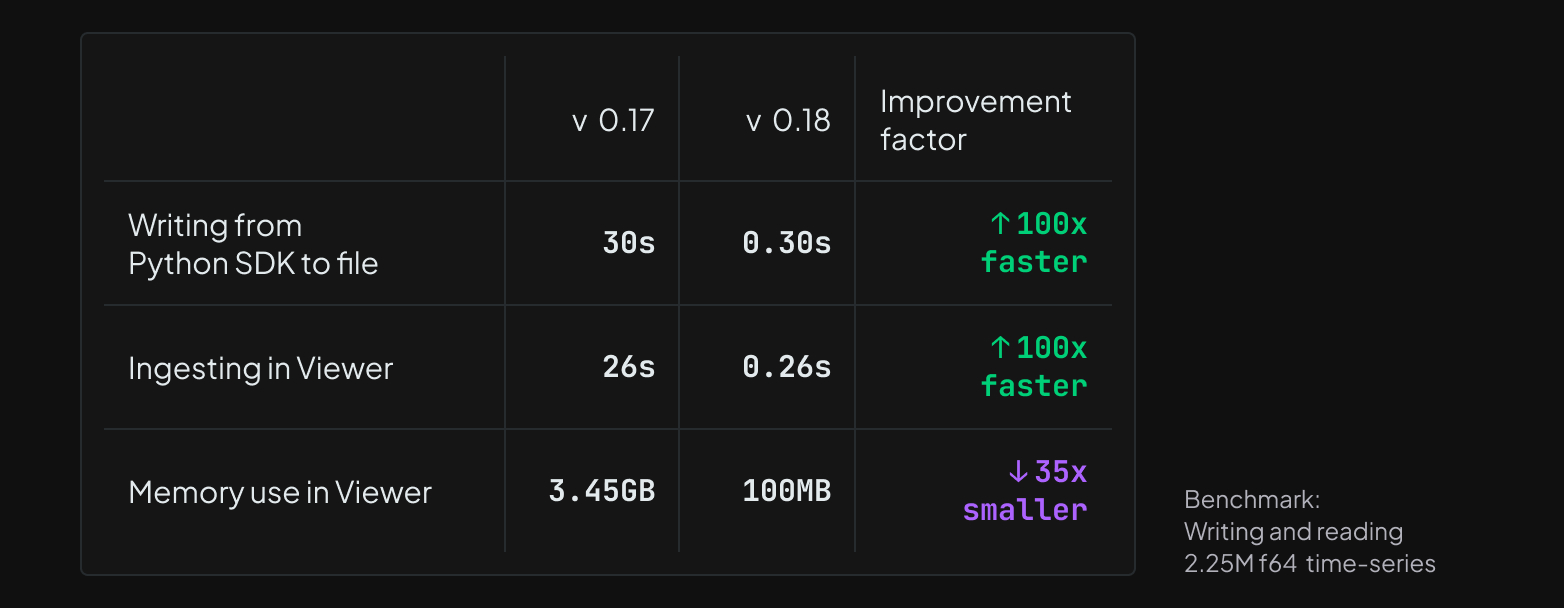
That's an improvement of 100x for write and ingestion speed, and 35x for memory overhead! From Rerun 0.18 on, we therefore consider (potentially pre-recorded) datasets containing millions of time points supported.
To get here we've redesigned our data model and indexing strategy to fully exploit column chunks, from the SDKs, through the data store, and all the way to the visualizers. To make it easier and more efficient to deal with pre-recorded data, we're introducing a new api, send_columns, for sending time-series columns to Rerun, as well as a cli tool for merging, pruning, and compacting .rrd files.
If you can't wait to try out the new faster chunk ingestion in Rerun 0.18, you can load the 2.25M scalars dataset from the benchmark mentioned above directly in your browser here. Read on to learn more about this new architecture, how it fits with Rerun's data model and some of the new tools and API's that support it.
Indexing column chunks instead of rows
Before Rerun 0.18, ingestion speed and memory usage scaled poorly for recordings with many time points (>100k).
The data store would build and maintain an index of individual rows,
which would dominate both ingestion time and memory usage for recordings with large amounts of small rows.
A single row contains all the data from a single rr.log call, so the worst case was many scalars over time.
From 0.18 on, the index instead points to chunks of columns. A chunk can be much larger than a small row, which reduces the overhead from many rows. Before digging into the details, lets do a recap of Rerun's data model.
The Rerun data model is based around streams of entities with components
In Rerun, you model your data using entities (roughly objects) with batches of components that change over time.
An entity is identified by an entity path, e.g. /car/lidar/points, where the path syntax can be used to model hierarchies of entities.
A point cloud could be made up of positions and colors, but you can add whatever components you like to the entity.
Point positions are e.g. represented as a batch of Position3D component instances.
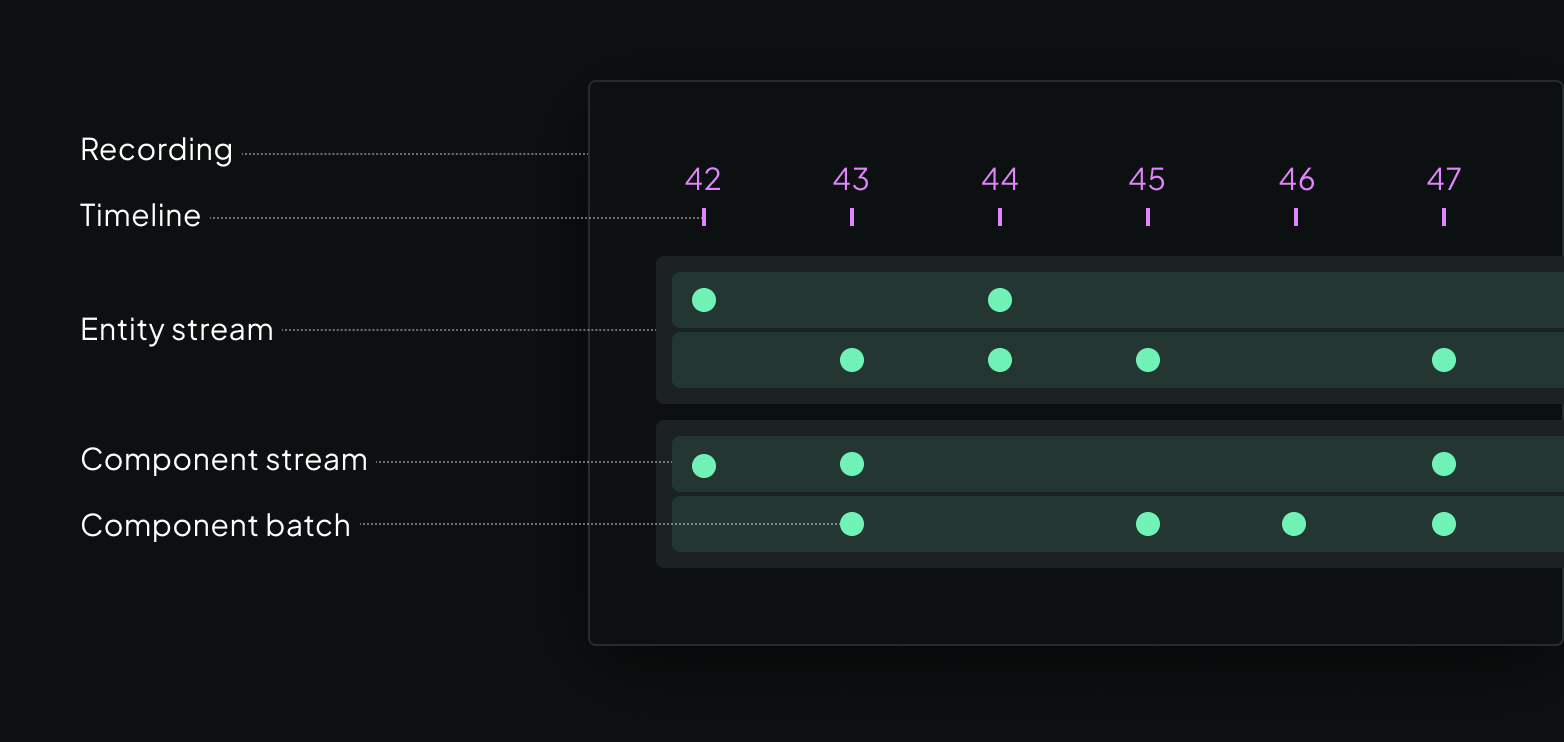
Components can have different values for different times, and do not have to be updated all at once. Rerun supports multiple timelines (sequences of times), so that you can explore your data organized according to e.g. the camera's frame index or the time it was logged.
The core queries are latest-at and range queries
All data that gets sent to the Rerun viewer is stored in an in-memory database, and there are two core types of queries against the database that visualizers run.
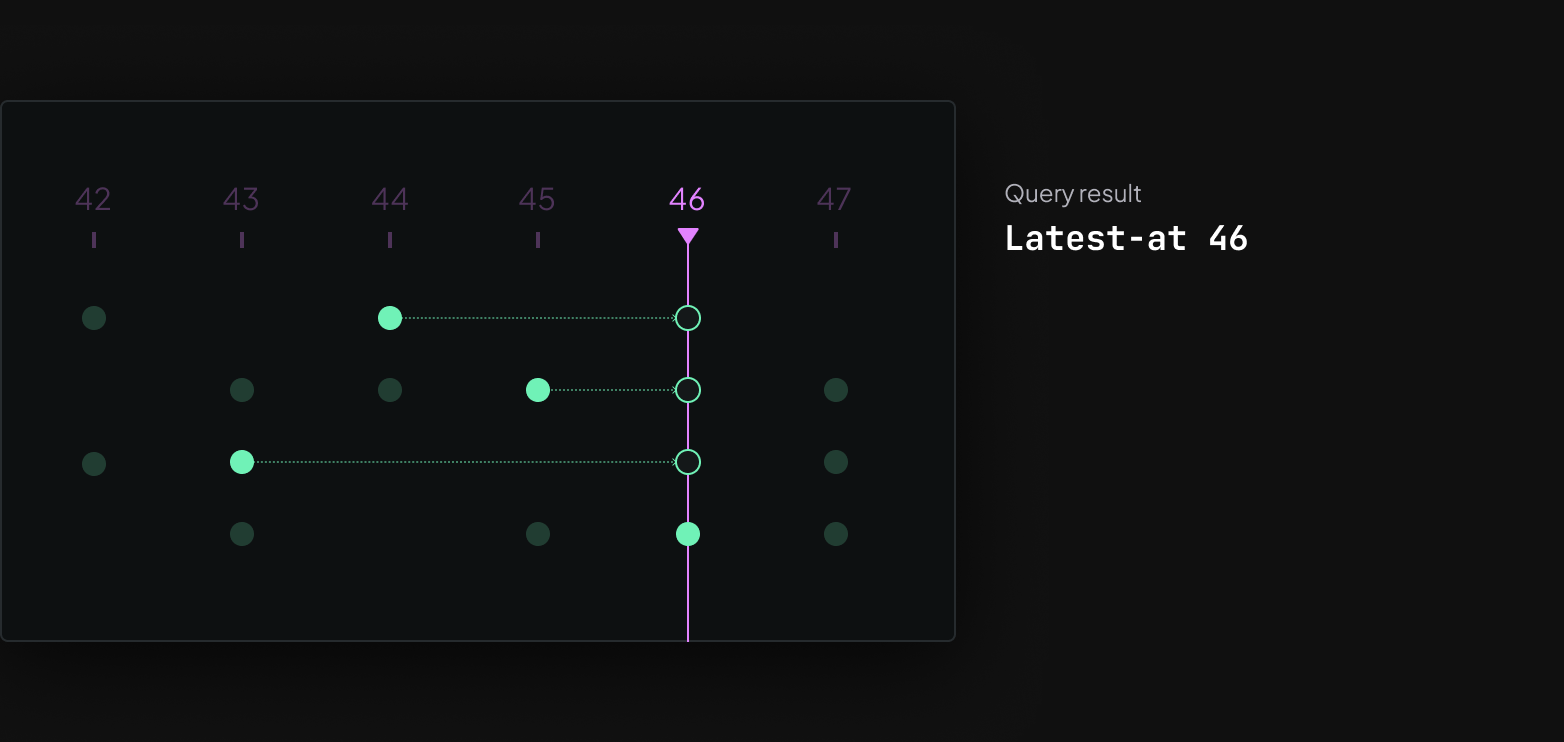
Latest-at queries collect the latest version of each of an entity's components at a particular time. This allows the visualizer to draw the current state of an object that was updated incrementally. For example, you might want to update the vertex positions of a mesh while keeping textures and triangle indices constant.
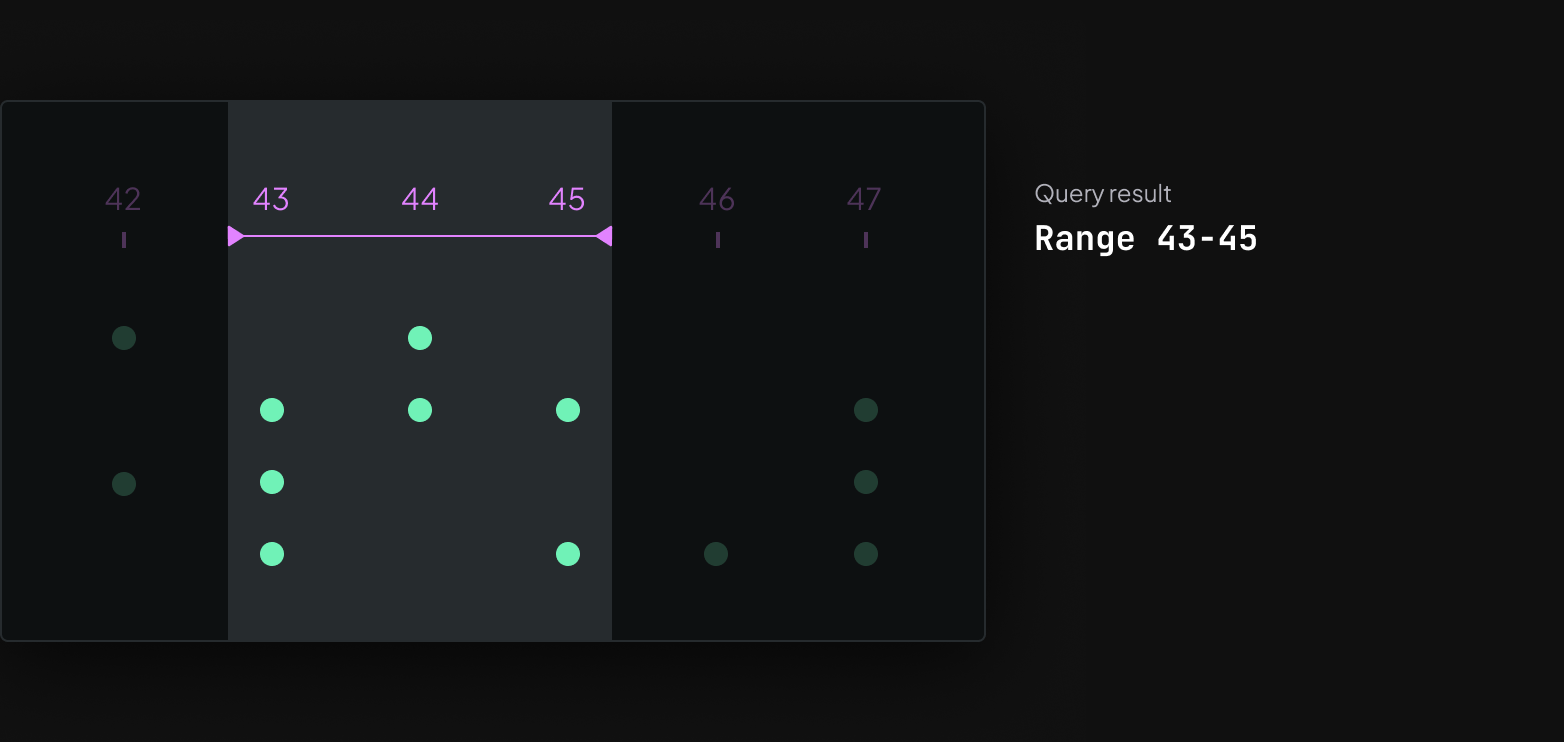
Range queries instead collect all components associated with times on a time range. These queries drive any visualization where data from more than one time is shown at the same time. The obvious example is time series plots, but it could also be used to e.g. show lidar point clouds from the last 10 frames together.
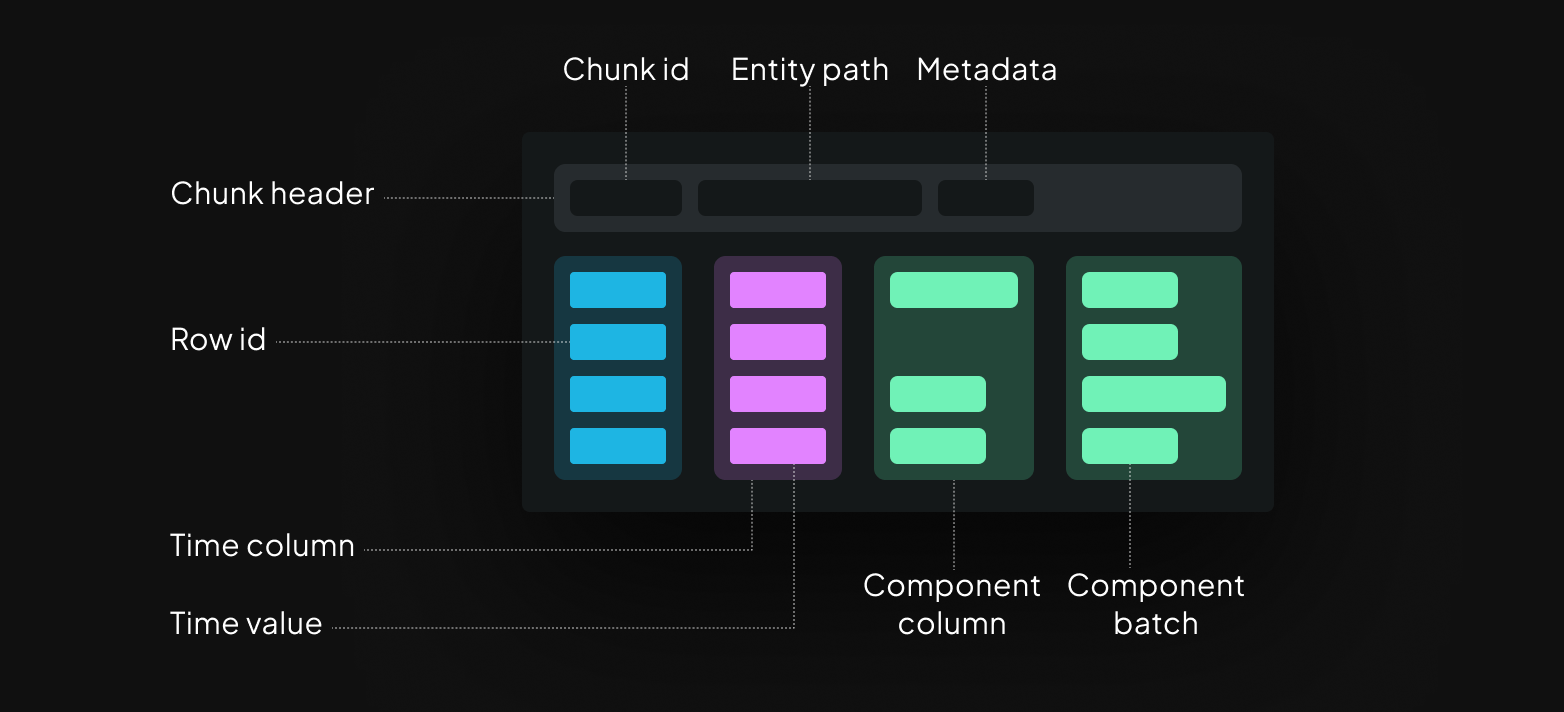
Storage is based around chunks of component columns
Since 0.18, the core storage unit in Rerun is the chunk. Prior to 0.18 it was similar but less formalized. Chunk columns are represented as Apache Arrow arrays, and the chunk header contains the chunk id, entity path, and other metadata like column statistics.
A component column contains one or more batches, which in turn contain one or more instances. Each component batch corresponds to a single row id and one time point per timeline. When you log data to Rerun, a single log call will correspond to one row and a single batch per component.
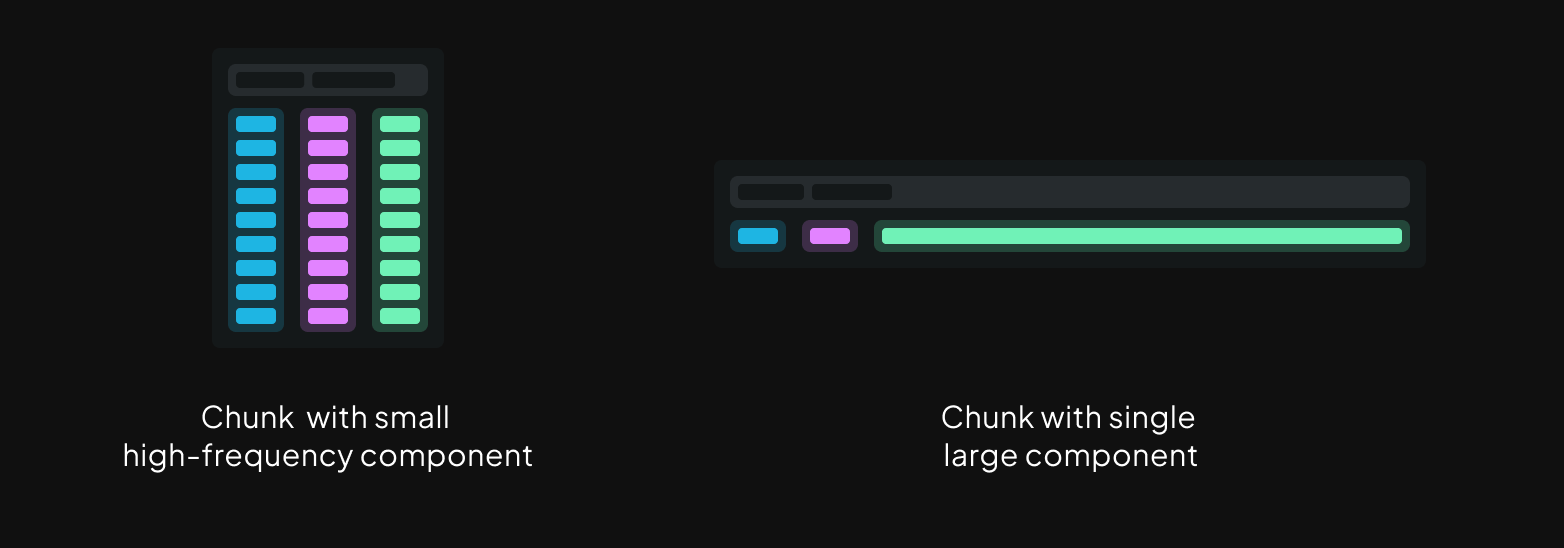
This design allows for keeping chunks within a target size range, even for recordings that combine low frequency but large data like point clouds or tensors (wide columns), with high frequency but small signals (tall columns).
Chunk indexes are smaller and faster to build than row indexes
Because a single chunk can contain many rows, chunk indexes use up much less memory than the row indexes Rerun used in prior versions. The downside is decreased query speed, but since chunks are usually sorted they tend to be fast to search. In addition latest-at queries are cached by the viewer so the effective performance impact is usually negligible.
Large enough chunks can be inserted untouched to the data store and the index can be built from the header alone. This makes ingestion extremely efficient on the happy path. For smaller chunks ingestion is still faster in 0.18 than previous versions since it's building a more coarse grained index.
Chunk compaction keeps efficiency high
In order to maintain high efficiency, Rerun needs to avoid letting the amount of chunks grow too fast. Small chunks are therefore compacted on ingestion to keep chunks within a target size range.
The Rerun CLI has new commands to merge, filter, and compact rrd files
To help improve efficiency for completed recordings, 0.18 introduces some new commands for working with rrd files.
Multiple files can be merged, whole entity paths can be dropped, and chunks can be compacted.
You can read more here,
but to give a sense of how it works the below example merges all recordings in a folder
and runs chunk compaction using the max-rows and max-bytes settings.
rerun rrd compact --max-rows 4096 --max-bytes=1048576 /my/recordings/*.rrd > output.rrdCompaction allows much simpler range query caching
When we introduced kHz time series support back in Rerun 0.13, we wrote about how that was powered by a range cache. Compaction during ingestion, and thus guarantees that chunks in the store won't be too small, allows us to simplify the caches for range queries significantly.
As long as the scalar columns in the chunks are sorted and large enough, they can be efficiently processed and rendered as is. That means that we now only need to cache sorted versions of chunks in cases where they aren't already sorted. This simplification of the cache further improves ingestion speed.
Standardizing on chunks all the way through
In addition to performance improvements, a huge benefit of the new chunks is a simplification of how all data is handled in Rerun. Chunks are now the main data interface that gets passed from the SDK, through the data store, and all the way to visualizers. This makes the whole system both much simpler and more efficient.
When you use rr.log you are effectively handing a row of data over to Rerun,
so how does the data store end up receiving column chunks?
Logged data gets batched into column chunks in the SDK
Before logging data, you can use the rr.set_time_ APIs to update the SDK's time context with timestamps for custom timelines.
For example, rr.set_time_sequence("frame", 42) will set the "frame" timeline's current value to 42 in the time context.
When you later call rr.log, the SDK will generate a row id and values for the built-in timelines log_time and log_tick.
It will also grab the current values for any custom timelines from the time context.
Any data passed to rr.log or rr.log_components becomes component batches.
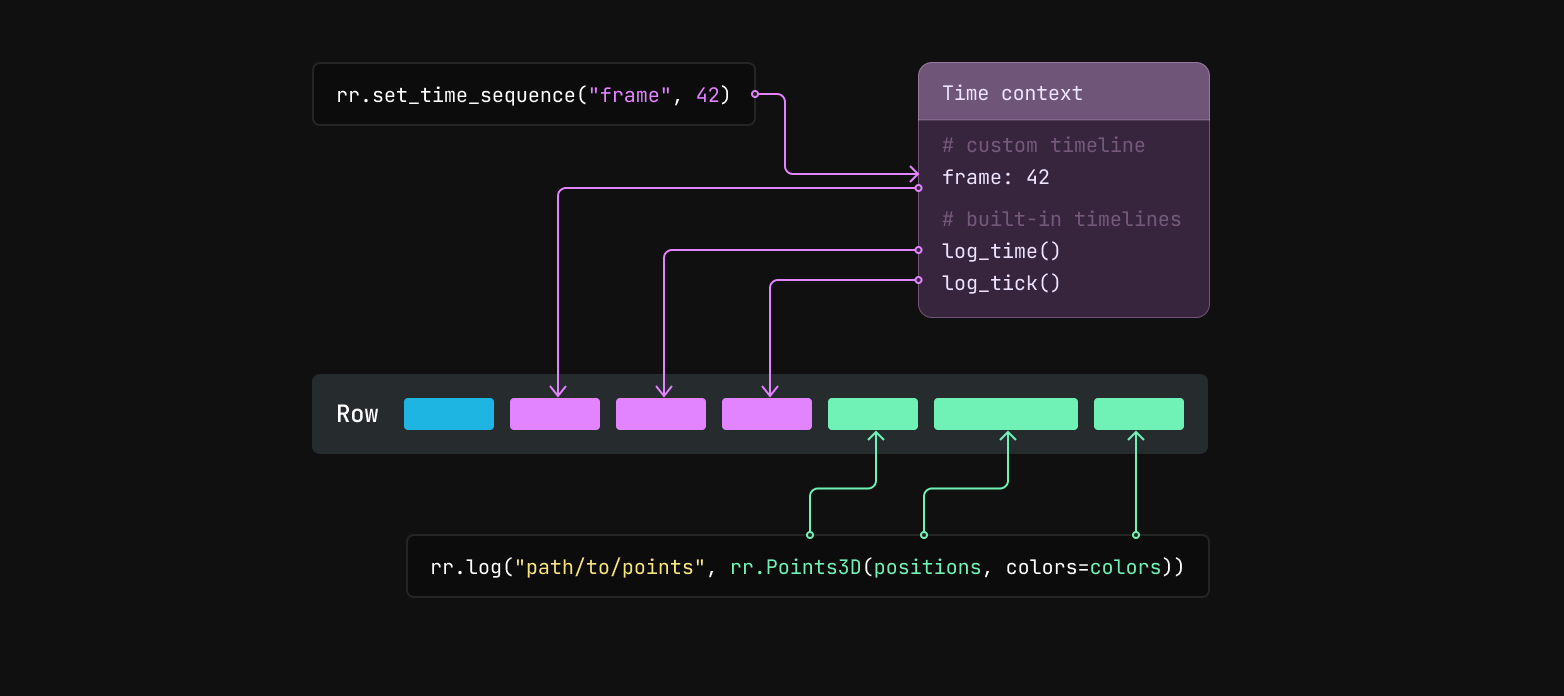
The row id, timestamps, and logged component batches are then encoded as Apache Arrow arrays and together make up a row. That row is then passed to a batcher, which appends the values from the row to the current chunk for the entity path.
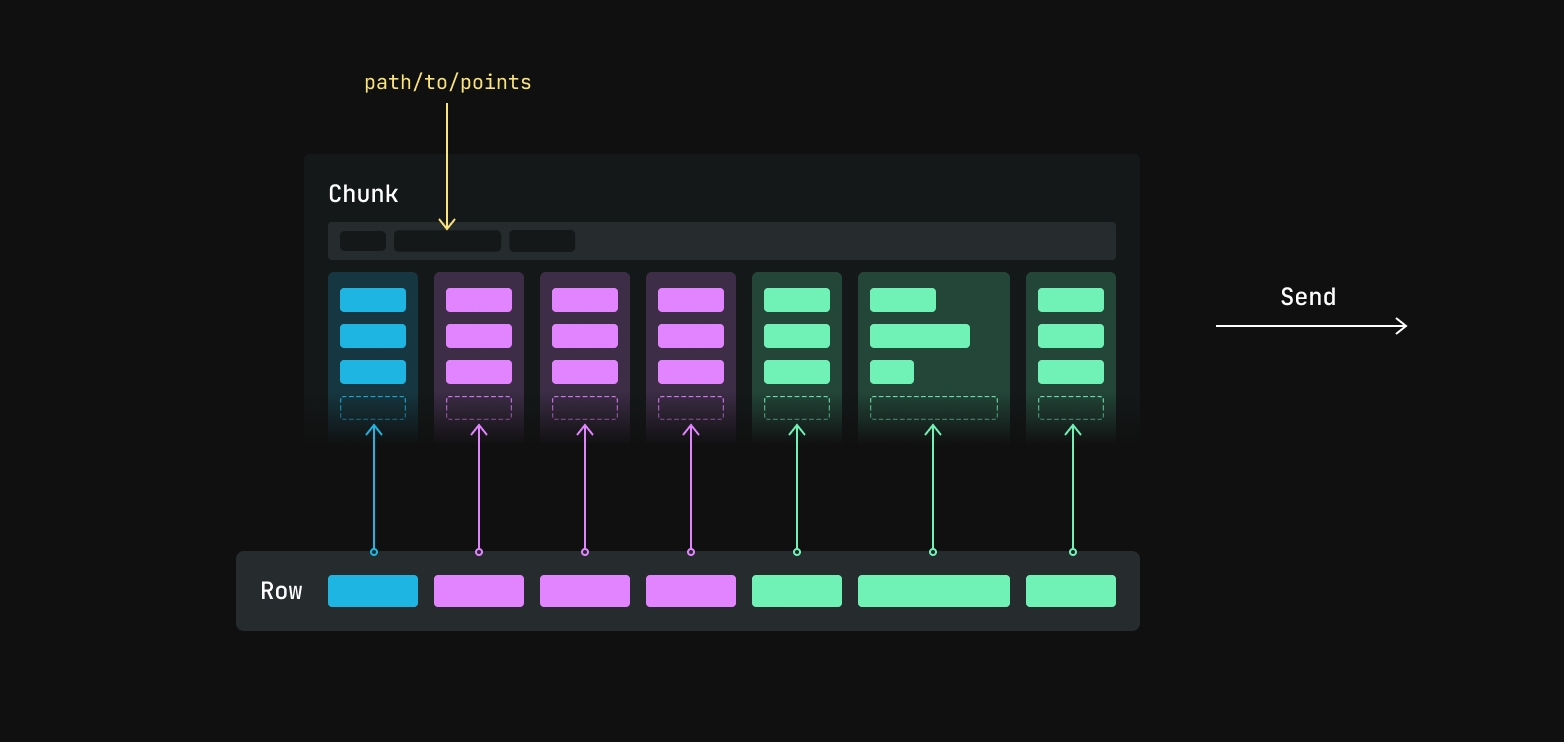
The current chunk is then sent to its destination, either periodically or as soon as it crosses a size threshold. Building up small column chunks before sending from the SDK trades off a small amount of latency and memory use in favor of more efficient transfer and ingestion. You can read about how to configure the batcher here.
Visualizers query for and render the contents of chunk columns
All the content inside views in Rerun are drawn by visualizers.
Any 3D point cloud is for instance drawn by the Points3DVisualizer.
Most visualizers need to be able to visualize the result of a range query,
which means the query interface to the data store needs to match the content of range query caches.
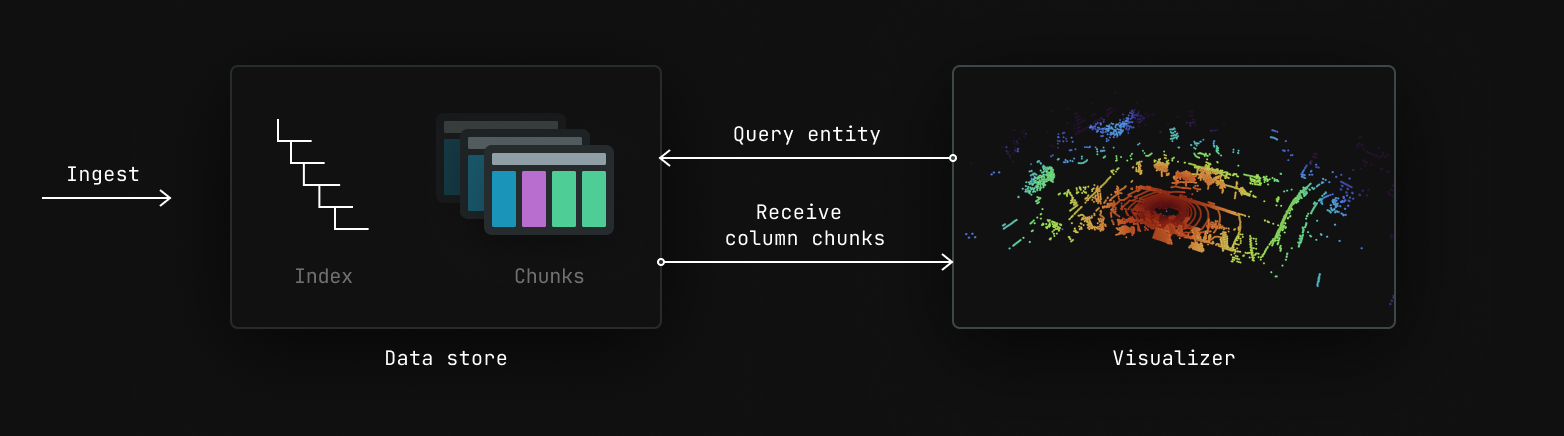
Since range query caches now only hold references to chunks, we can now pass chunks through all the way to visualizers. This means that a chunk columns often passes untouched from the SDK, through the data store, all the way to a visualizer where it's copied straight to the GPU. Simple and fast.
A new columnar API for sending data to Rerun
The rr.log API was designed to extract data from your running code as it's being generated.
If you already have data stored in something like time columns,
it's both a lot easier and more efficient to send it to Rerun in that form directly.
That's why we're now introducing the rr.send_columns API that does just that.
Before looking at the new API, let's look at the code for getting a scalar time-series into Rerun with the rr.log API.
import numpy as np
import rerun as rr

rr.init("rerun_example_log_scalar", spawn=True)

times = np.arange(0, 64)
scalars = np.sin(times / 10.0)

# Loop over the arrays and update the time context before each log call.
for step, scalar in zip(times, scalars):
    rr.set_time_sequence("step", step)
    rr.log("scalar", rr.Scalar(scalar))
The rr.log API forces you to loop over the data and incur the overhead of updating the time context,
encoding to Apache Arrow, and running the batcher for every time step.
The rr.send_components version below skips the loop and handles everything in a single efficient call.
import numpy as np
import rerun as rr

rr.init("rerun_example_send_columns", spawn=True)

times = np.arange(0, 64)
scalars = np.sin(times / 10.0)

# Send both columns in a single call.
rr.send_columns(
    "scalars",
    times=[rr.TimeSequenceColumn("step", times)],
    components=[rr.components.ScalarBatch(scalars)],
)
The rr.send_columns API bypasses the time context and batcher
The rr.send_columns API is designed for cases where you already have your data in columnar form
and want to send it directly without the semantics of logging.
Because of that, it doesn't use the time context and bypasses the batcher.
This gives you the control to create large column chunks that are fast to process and compress better on disk.
The next step is querying recordings from the SDK
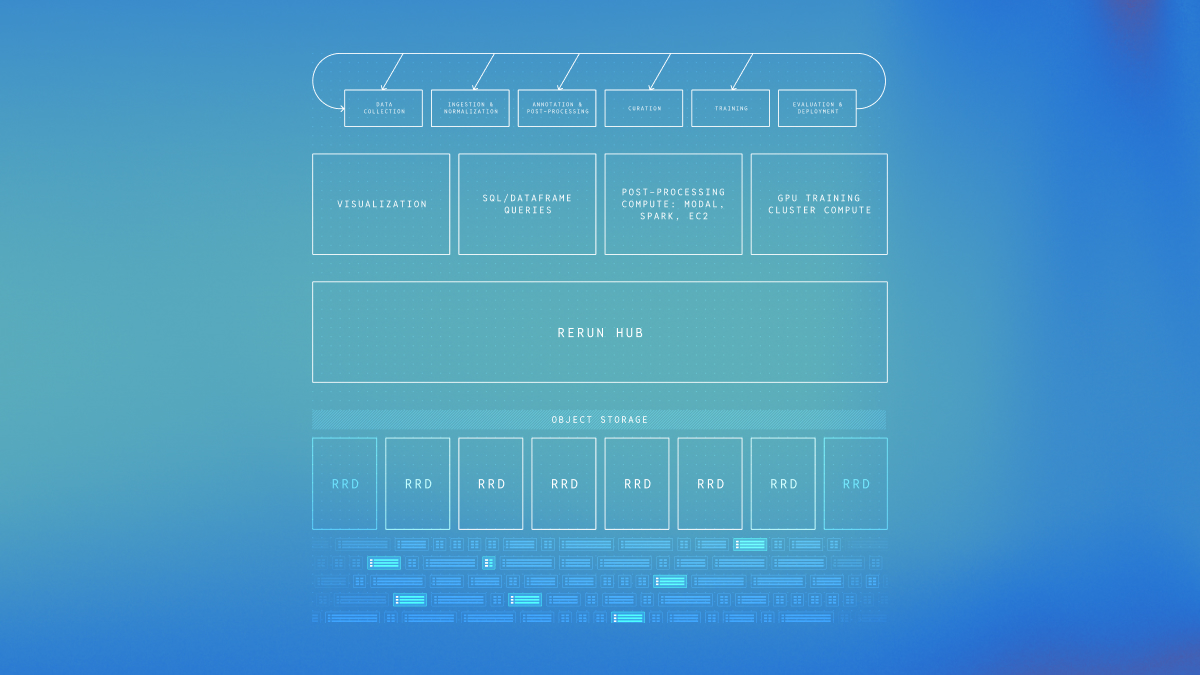
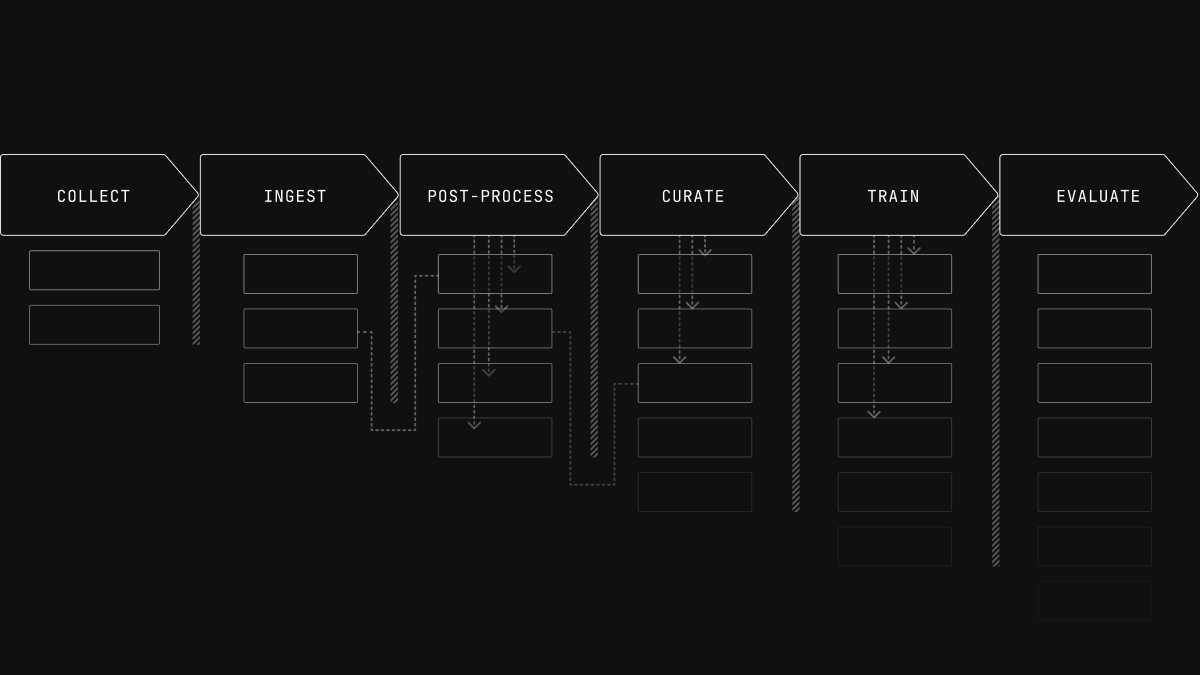
Getting to this point has been a multi month journey. In addition to the big improvements this new architecture brings for 0.18, it's also the base on which we'll be making it possible to query your multimodal recordings directly from the SDK. Over time Rerun will start looking a lot like a general data management system focused on robotics-style data, with world class visualization built in.
If this sounds interesting to your team, make sure to send us a note at hi@rerun.io. As always we'd love for you to join us on on Discord and Github to share feedback, thoughts on what you'd like to see next, and to just show off some of the cool stuff you're building.