Defaults and overrides for any data
One of our goals at Rerun is to help teams unify their visualization stacks for multimodal robotics-style data.
You get data into Rerun by logging it with our SDK. How that data gets visualized is then determined by the viewer's active blueprint; the spec describing everything from layout of views, what data goes where, and any options for how to render data in each view. Blueprints are either sent from code, built interactively in the Viewer, or generated automatically based on the data.
The 0.17 release of Rerun brings a huge increase in the explicit control you can have over your visualizations. You can now use blueprints to both set default component values on a view, and to override components on specific entities in the view.
In the video below, we use a default to bulk edit the size of all camera frustums, which gets tedious to do one at a time, and an override to edit just the front facing frustum size.
Control and see what drives visualizations
With the introduction of blueprint overrides and defaults, Rerun 0.17 also gives you direct control over what visualizers are applied to what entities, and makes all of this easy to inspect in the UI. Together, these features increase the amount of flexibility and control you have over exactly how your data is visualized in Rerun.
Below are a couple examples to give you a taste of some of the things you can now do.
In the first video we dynamically change the visualizer that is applied on an entity from Mesh3D to Points3D and then edit the radius of the points.
Because this mesh has vertex colors, the point cloud automatically becomes colored as well.
You can now control things like opacity for the image like visualizers (color, depth, segmentation) per entity. This video shows overriding the opacity of a segmentation image to hide or reveal the color image below it.
It's possible to apply multiple visualizers for a single entity and override any visualizer inputs. Here we play around with the line and point visualizers for a time-series.
Separate styling from data when you want to
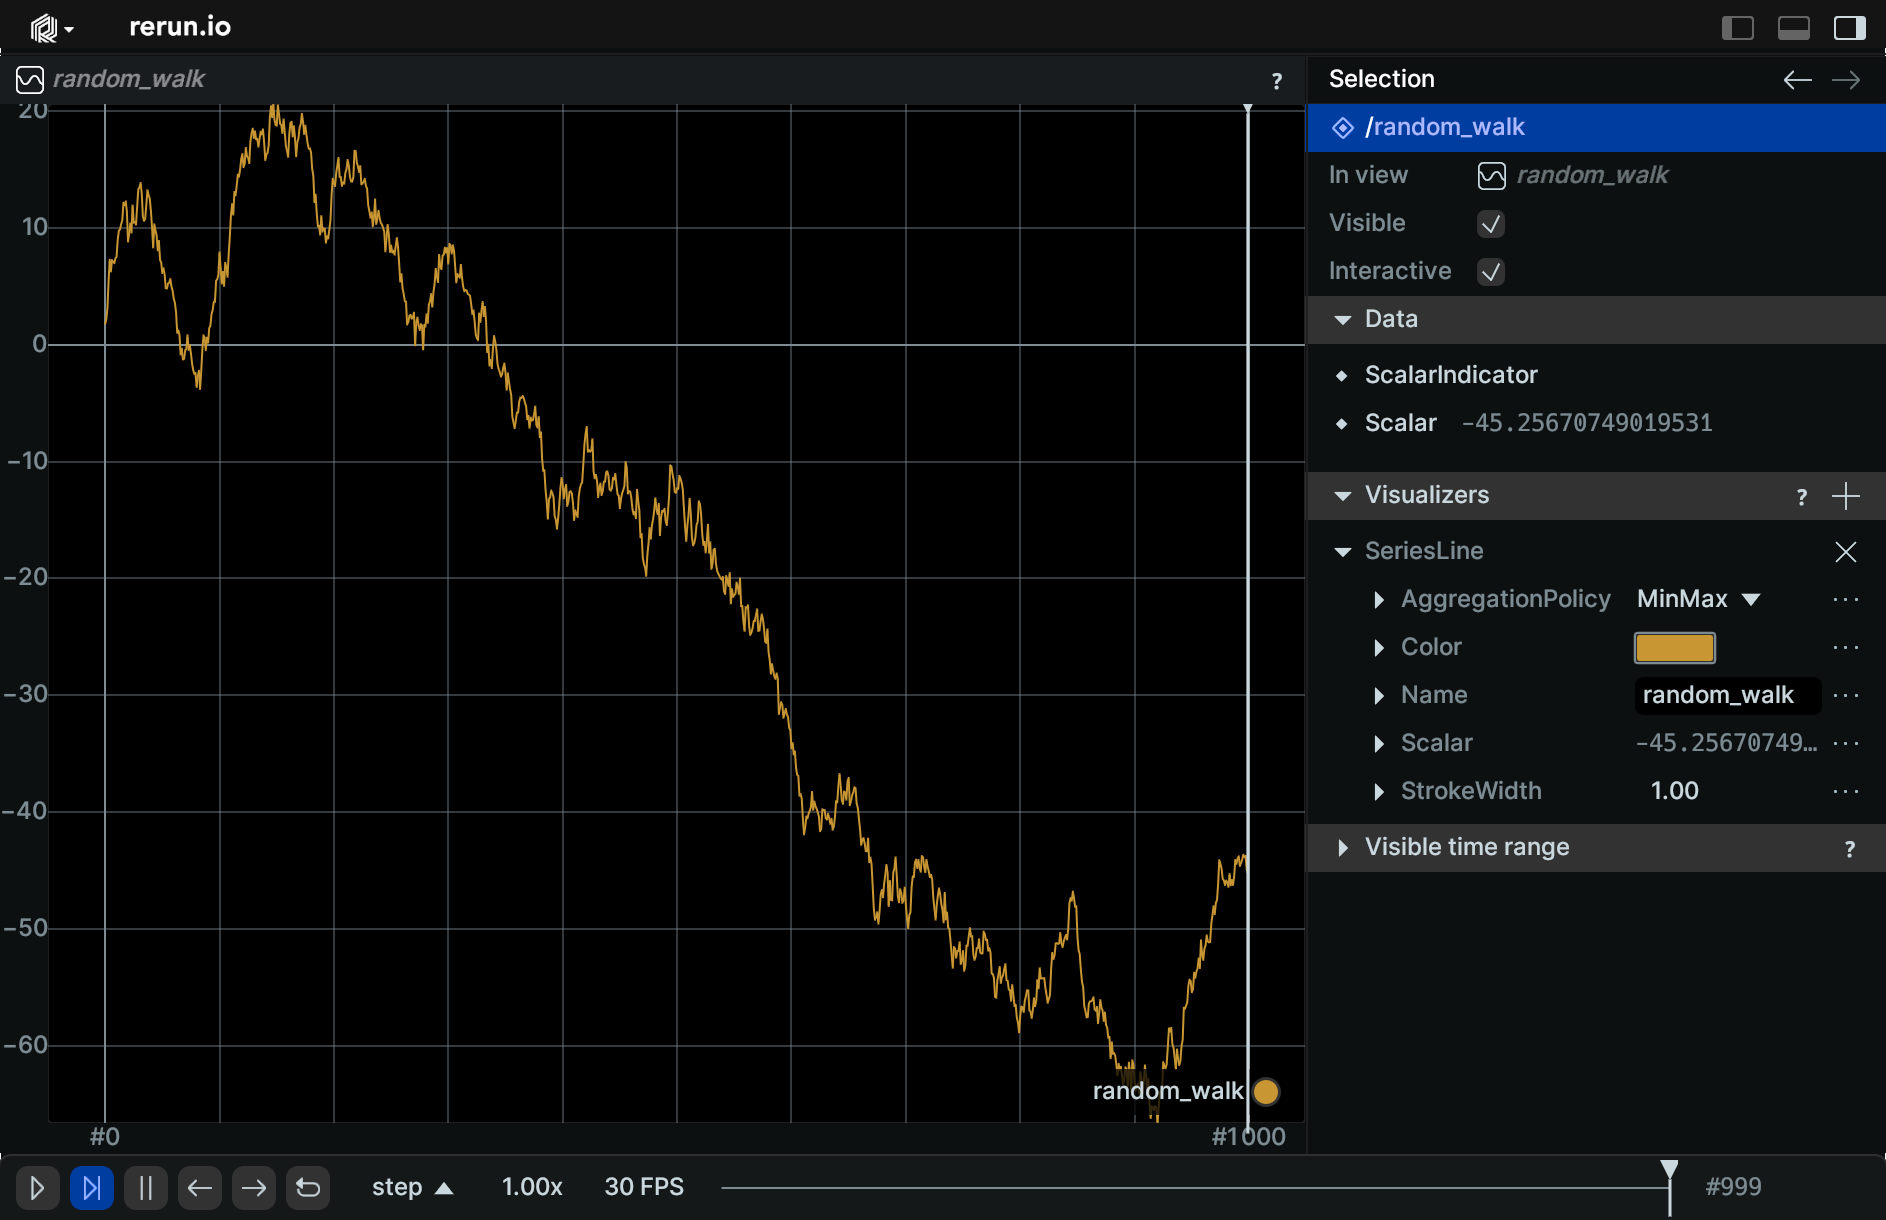
With Rerun 0.17 it's finally possible to separate styling from your recorded data when you want to. To configure and style visualizations from code you would previously have to log "styling components" in the same recording as your data. You can now use defaults and overrides in the blueprint to keep what you consider styling or configuration separate from your data. For example, the below code styles a time-series plot by overriding the color and stroke width in the blueprint.
import numpy as np
import rerun as rr  # pip install rerun-sdk
import rerun.blueprint as rrb

rr.init("rerun_example_random_walk", spawn=True)

# Send a blueprint that uses overrides to style the plot
rr.send_blueprint(rrb.TimeSeriesView(
    origin="random_walk",
    overrides={"random_walk": [
            rr.components.Color([200, 150, 50]),
            rr.components.StrokeWidth(1)
        ]}
))

# Log a randomly evolving series of scalars
value = 0.0
for step in range(1000):
    value += np.random.normal()
    rr.set_time_sequence("step", step)
    rr.log("random_walk", rr.Scalar(value))
If you select the time-series entity /random_walk, you can see that the visualizer is using the color and stroke width you set from code.
A formalized system for sourcing data to visualization
The ability to set both default and override components in the blueprint are part of a new formalized system of how data gets sourced for visualizations. The goal is to make it easier for users to precisely understand how each visualization gets generated, and to give full control over that process.
For each entity that is visualized in the viewer, you can now see and edit the list of visualizers that run on it, what components they expect, and how each visualizer is sourcing the data for it's inputs. For any input component to a visualizer, the final value is resolved in the following order:
- Override: the per-entity override (the highest priority)
- Store: the value that was logged to the data store (e.g., with the
rr.log()API) - Default: the default value for this component type
- Fallback: a context-specific fallback value which may depend on the specific visualizer and view type (the lowest priority)
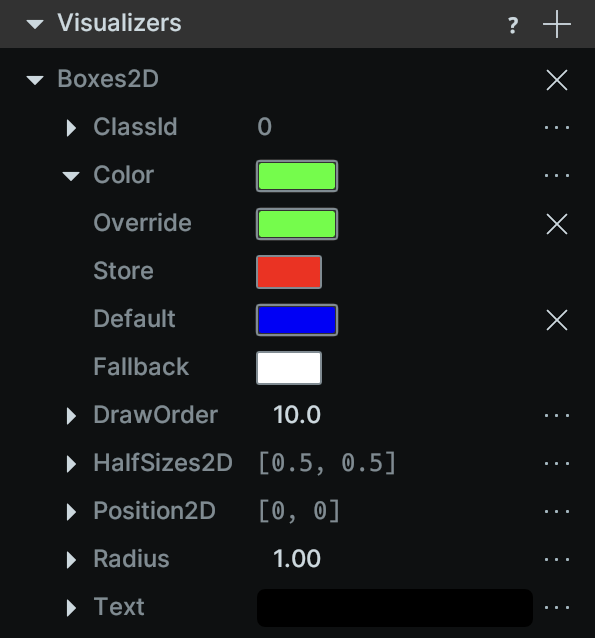
Here is an example of controlling the color value of a 2D box via a default, the data store, and an override.
import rerun as rr
import rerun.blueprint as rrb

rr.init("rerun_example_component_override", spawn=True)

# Data logged to the data store, including a color (2nd highest priority).
rr.log("boxes", rr.Boxes2D(centers=[0, 0], sizes=[1, 1], colors=[255, 0, 0]))

rr.send_blueprint(
    rrb.Spatial2DView(
        overrides={
            "boxes": [
                # Set an override color for the boxes entity (highest priority)
                rr.components.Color([0, 255, 0]),
            ]
        },
        # Add a default value for all color components in this view (3rd highest priority)
        defaults=[rr.components.Color([0, 0, 255])],
    ),
)
If you run the above code and select the boxes entity in the 2D view, you can see the priority stack of the color component input for the Boxes2D visualizer. As you can see, the green [0, 255, 0] color from the override got picked since it has the highest priority.
If you want to learn more about component defaults and overrides and how they get applied check out this concept walk through in our docs.
Data vs styling should be a user decision
A core design tenet we've had at Rerun for a long time is that what should be considered "data" and what should be considered "styling" has to be a user decision. Take something as simple as the color of a detected point. Your detection algorithm might estimate the true color of the detected point, in which case color is obviously data. You may also want to color all detected points blue and all tracked points green to make them easy to visually distinguish, in which case color is clearly styling.
This idea has led us to build a system that doesn't distinguish between "data" and "styling". Instead, visualizers have inputs (e.g. positions, colors, labels, radii) which are sourced from either data recordings or blueprints. Any loggable data can also be put in the blueprint, which gives you maximum control to model things in the way that best fits your application. We've been laying the groundwork to enable this design for over a year and are excited to finally be able to deliver this big leap in expressive power.
Fundamentally, we believe that this is the only viable approach to unify the visualization stack for robotics and embodied AI.
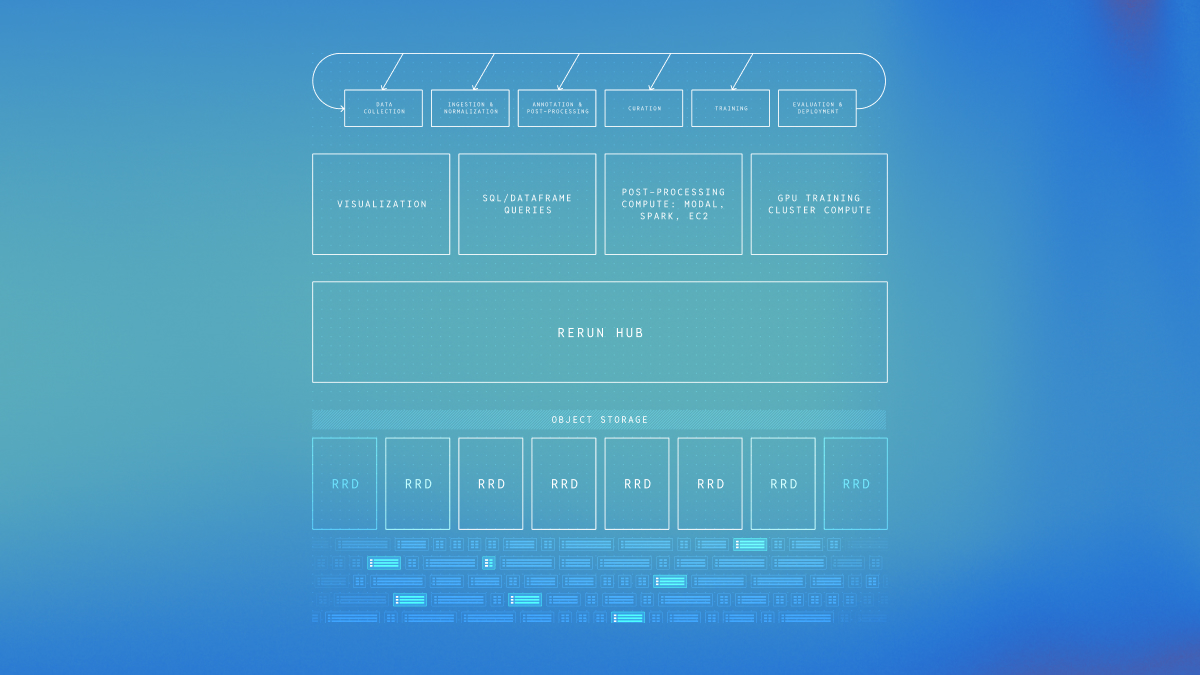
Rerun's database first design enables this flexibility
A big piece of the performance and flexibility that Rerun already has comes from the database first design approach we've taken. Instead of spreading out data problems like caching, joining and aligning data in time throughout the application, we've pushed that complexity into the data store and query engine. This allows us to solve these problems in more principled and unified ways, which in turn helps us drive performance and flexibility.
The result is our in-memory multimodal time-series database, built around Apache Arrow. In addition to holding all the data you log to Rerun, we use an instance of that database to also hold the blueprint, i.e. the application state. This is what allows Rerun to support putting any loggable data directly in the blueprint, which is what enables blueprint defaults and overrides.
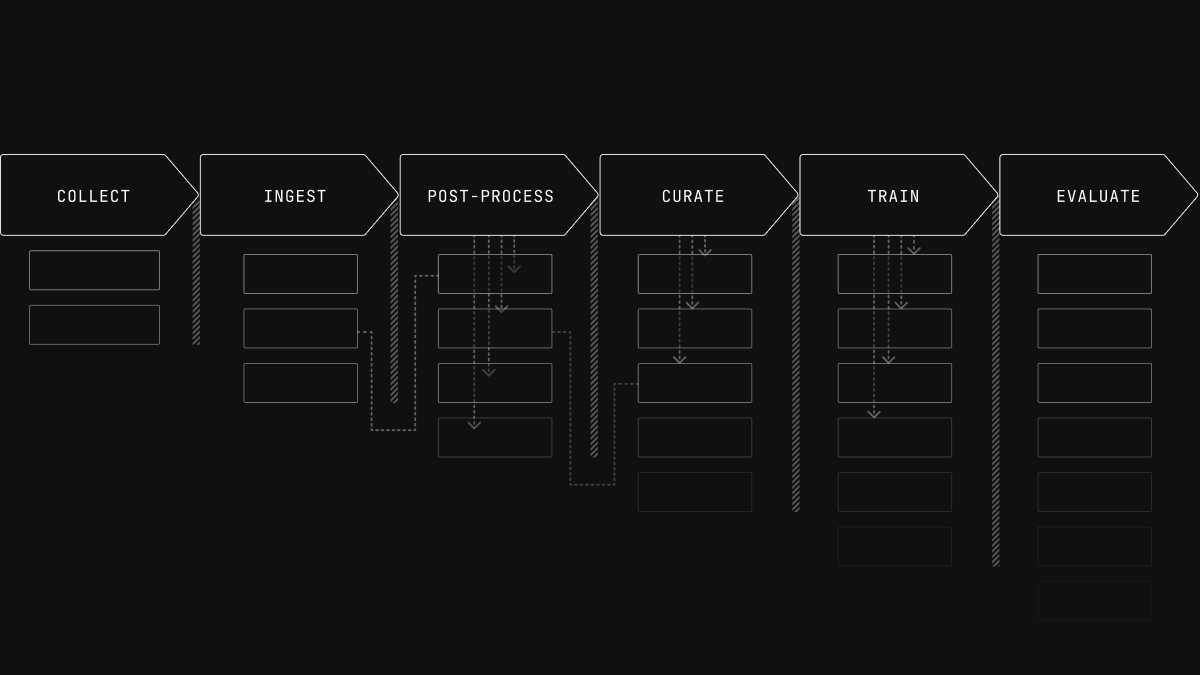
We're doubling down on the database
A large focus for Rerun going forward will be the database aspect of Rerun. You can currently insert data into the Rerun database by logging data, which means one call per time point. We'll be extending that so you'll also be able to insert data in time-batches efficiently. The query engine we've built is currently only used inside the viewer but we'll be exposing data queries against recordings to the SDK as well.
This work is all building up towards our coming commercial data platform. If you're a robotics or embodied AI company looking to upgrade your data platform or build out your data engine and are interested in potentially becoming a design partner, send us a note to hi@rerun.io.
Make sure to join us on Discord and let us know what you think of this latest release and show the community what you've built with defaults and overrides. We're excited to see you there.