Robotics
Any scalar
A 6-minute narrated walkthrough of using the Rerun UI to plot arbitrary scalar data from a dataset (MCAP) is available on Youtube.
Overview
This example demonstrates how to visualize arbitrary data, even when it was not logged with specific Rerun-semantics. With the "Any Scalar" feature, you can log complex data structures (like dictionaries or structs) once and use Selectors in the Blueprint to "pick" which internal fields to plot.
Key Benefits:
- Decoupled Logging: You no longer need to log separate scalar entities for every value you want to graph.
- Selective Visualization: Use a single data stream to power multiple different views by targeting specific component fields (e.g.,
.positionor.close).
Run the code
To run this example, make sure you have the required Python version, the Rerun repository checked out and the latest SDK installed:
pip install --upgrade rerun-sdk  # install the latest Rerun SDK
git clone git@github.com:rerun-io/rerun.git  # Clone the repository
cd rerun
git checkout latest  # Check out the commit matching the latest SDK release
Install the necessary libraries specified in the requirements file:
pip install -e examples/python/any_scalarTo experiment with the provided example, simply execute the main Python script:
python -m any_scalar --demo robotics # Simulated PID control
python -m any_scalar --demo market   # Real-time stock performance
If you wish to explore additional features, use the CLI with the --help option for guidance:
python -m any_scalar --helpGuided demos
1. Robotics: PID controller telemetry
Goal: Visualize a control loop's internal state without logging separate scalars for every field.
In robotics_demo.py, we simulate a joint controller. Instead of logging error, effort, and position as individual Rerun entities, we log a single Telemetry struct per time step.
Tutorial highlights:
- Decoupled logging: We log one
ControllerTelemetryobject. Later, in the Blueprint, we "pick" which parts to see. - Visualizer mapping: Notice how the
Errorfield is plotted twice: once as a Line (to see trends) and once as Points (to see individual sample timing). - Step interpolation: The
Effortsignal usesStepAfterinterpolation, which accurately reflects how a digital controller holds its output constant between steps. - Boolean plotting: The
is_stableflag is visualized as a step-function scalar (0/1).
What you should see when running python -m any_scalar --demo robotics:

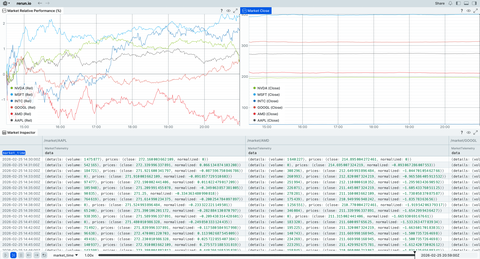
2. Market data: relative performance
Goal: Compare multiple live data streams (tickers) using a centralized selector.
In market_demo.py, we fetch real stock data. We log the raw prices and a "normalized" % change field.
Tutorial highlights:
- Dynamic normalization: We log the price relative to the morning opening.
- Dynamic archetype: We log the stock data as a dictionary using
rerun.DynamicArchetype. - Selectors: We use
jq-style selectors, like.prices.normalizedand.prices.close, to power different parts of the dashboard.
What you should see when running python -m any_scalar --demo market:
3. Load datasets directly into the viewer
Goal: Plot values from dataset files without writing any code.
Because Rerun can now plot Any Scalar, you can drag an .mcap or .rrd file into the viewer and create a Time Series view. Use the UI in the viewer to drill into nested ROS messages or telemetry logs and start plotting immediately.
The "Magic": component mapping
What is "Any Scalar"?
Traditionally, to plot a graph, you had to log data specifically as one of Rerun's Scalar archetypes. With Any Scalar, you can log complex blobs (Dictionaries, TypedDicts, Arrow Structs) and Rerun will let you "map" internal fields to visualizers.
Selectors (jq-style)
Rerun uses a path syntax inspired by jq to reach into your data:
.state.position-> reaches into thestatedict and findsposition..prices.normalized-> pulls the calculated performance from the market tick.
Benefits
- Developer velocity: Log your entire state object once; decide what to plot later in the UI.
- Smaller files: Less metadata overhead than logging 50 separate entities.
- Flexibility: Change what you are visualizing in the Blueprint without restarting your simulation or re-running your data pipeline.