Light mode, streaming video and data model improvements
Rerun is building the multimodal data stack for teams that build Physical AI.
A core piece of this mission is our open source viewer and we’re excited to announce its 0.24 release! Take a peek at the changelog to see all that’s been improved.
Take a visual tour take-a-visual-tour
You can read about all the shiny new features below, or be brought on a video tour:
Here are some of the highlights.
Light Mode light-mode
Rerun now respects your system theme settings. If your operating system is set to auto-switch between light and dark mode, the Rerun viewer will follow suit. Of course, you can still toggle manually if you prefer to force a specific theme.

Embedded viewers in the web or a Jupyter notebook will also respect the system theme. This reflects a broader effort to make the Rerun viewer feel cohesive in the environments you already work in.
Live Streaming Video live-streaming-video
Rerun 0.24 introduces full support for streaming encoded video, making it easier than ever to log and visualize video data.
Cameras are critical sources of data, especially in robotics, but logging raw camera images often creates storage headaches and long processing times. A sequence of uncompressed 1080p images can easily exceed 10GB per minute. Video encoding typically compresses by about 20x, meaning the equivalent video would only be 500MB. That’s why engineering teams and researches often use video when storing and sharing datasets.
Previously, Rerun supported video via the AssetVideo archetype, which required a completed video file. This was great when logging to file, but meant you couldn't see the video stream live in the viewer as it was being captured.
With the new VideoFrame archetype, you can now log video packets directly from an encoding stream. This gives you the best of both worlds: the massive compression benefits of video encoding and the low-latency feedback of live visualization.
How to get started how-to-get-started
The Video page of the Rerun docs will give you all the practical considerations for logging video. You can log video packets in real-time using standard codecs like H.264. Here’s what it looks like with the pyav library:
import rerun as rr
import av  # pyav for encoding packets
import numpy as np

# One-time static metadata
rr.log("video", rr.VideoStream(codec=rr.VideoCodec.H264), static=True)

# In a real app, you need to build the h264 encoder
container = av.open(...)
stream = container.add_stream(...)

# For each raw image
image = np.random.randint(0, 255, size=(100, 200, 3), dtype=np.uint8)
frame = av.VideoFrame.from_ndarray(image, format="rgb24")
for packet in stream.encode(frame):
		rr.set_time("time", duration=float(packet.pts * packet.time_base))
    rr.log("video", rr.VideoStream.from_fields(sample=bytes(packet)))
See the complete, runnable example here.
Some technical tips and limitations:
- Because these packets are designed to be decoded and displayed immediately by the viewer, B Frames are not yet supported, as they require packet look-ahead.
VideoFrameonly supports h264 for now. We will add support for the remaining codecs in the near future.AssetVideohas support for more codecs, depending on native or the web. View the full codec support on our video reference page.- While we continue to improve the video experience in Rerun native, if you experience some playback issues, try running in the Rerun web viewer. Modern browsers with GPU acceleration have advanced video decoding capabilities that the Rerun viewer can take advantage of.
- ROS video messages, such as those created by the
*_image_transportpackages, can now more naturally be ingested using theVideoFrame. This pipeline will become built-in in upcoming releases. - Because of encoding/decoding overhead, there is some amount of latency (about 0.5s) between when packets are logged and when they are displayed in the viewer. This is helped by using aggressive encoding options, such as FFMpeg’s “ultrafast” preset. See the examples for how this looks.
For a practical example, this video encoding feature is used in our proposed integration with LeRobot.
Built-In URDF Data Loader builtin-urdf-data-loader
Rerun 0.24 now features a built-in URDF data-loader. This data-loader will automatically process any .urdf file that’s logged.

Before, you needed to download and register an external data-loader, like our URDF data-loader example. This can be somewhat cumbersome, so we've brought this into the main repository.
When logging joint angles with an entity path equal to the joint’s location in the URDF hierarchy, the viewer dynamically animates the robot based on these angles.
Here's how you can easily log a URDF and animate your robot:
from pathlib import Path
import rerun as rr
from rerun import RotationAxisAngle

rr.init("urdf_example", spawn=True)

urdf_path = Path("/path/to/robot.urdf")
rr.log_file_from_path(urdf_path, static=True)

# Later, in your logging code, you'll log each joint:
urdf_joint_path = "/path/in/URDF/shoulder"
joint_axis = [0, 1, 0]  # comes from URDF
joint_angle = 1.216     # radians
rotation = RotationAxisAngle(axis=joint_axis, angle=joint_angle)
rr.log(
  urdf_joint_path,
  rr.Transform3D(rotation=rotation),
)
For similar code in Rust, we have a full example here.
You can see a full Python example of logging the SO-101 arm, as demoed in the walkthrough video, in our proposed PR to the LeRobot repository here.
And finally, the URDF GitHub issue can be found here.
Multi-Sink Support multisink-support
A common request from users has been the ability to simultaneously visualize a live robot while recording logs to a file. Rerun 0.24 allows you to do this by configuring multiple output sinks.
Setting multiple sinks is easy with the set_sink API:
import rerun as rr

# Initialize the SDK and give our recording a unique name
rr.init("rerun_example_set_sinks")

rr.set_sinks(
    # Connect to a local viewer using the default URL
    rr.GrpcSink(),
    # Write data to a `data.rrd` file in the current directory
    rr.FileSink("data.rrd"),
)
Technical note: when streaming to multiple sinks, there’s a tradeoff between storage efficiency and viewer latency. The micro-batcher holds data until a buffer fills, then flushes the chunks to each sink. Larger buffers produce less fragmented .rrd files, but increase delay in the viewer. Tune your batch size to match your priorities.
There's also a new doc page detailing the various tradeoffs if you want to learn more.
Tagged Components tagged-components
We’ve been improving the relationship between components and archetypes in our data model since 0.22. In this release, that final evolution and distribution of these changes throughout the codebase is complete. We call them Tagged Components.
Before we explain the details, here are a few things you might notice:
- No more indicator components. These were sentinel values to help the viewer determine a component’s archetype for visualization. Now, these are part of the component descriptors themselves.
- Components are grouped by archetype throughout the viewer. This gives us some nice UI improvements we’ll see below.
- You can now log multiple components with the same component type to the one entity path, making logging more flexible and paving the way for complex archetypes.
Previously, each entity could only have one component type logged to it, but this proved limiting. For example, if you wanted to log both an Arrows3D and a Boxes3D to the same entity with different colors, one Color Component would overwrite the other. In Rerun 0.24, both color components can exist without conflict.
What’s new? whats-new
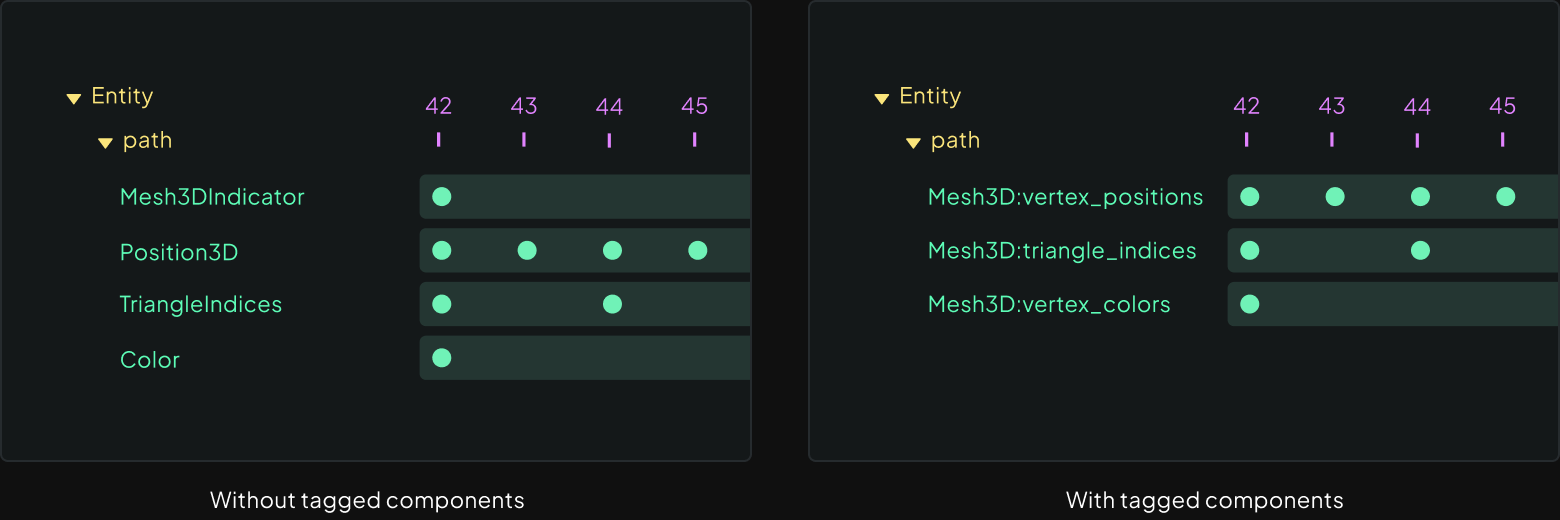
With this update, each component is now tagged with its archetype and component field name. In the UI, Instead of listing components by their component type (Position3D) with an archetype indicator (Mesh3DIndicator), we list them by their field name (vertex_positions), and clearly group by archetype. This grouping removes all redundant indicators, saving disk space and memory while reducing visual clutter:
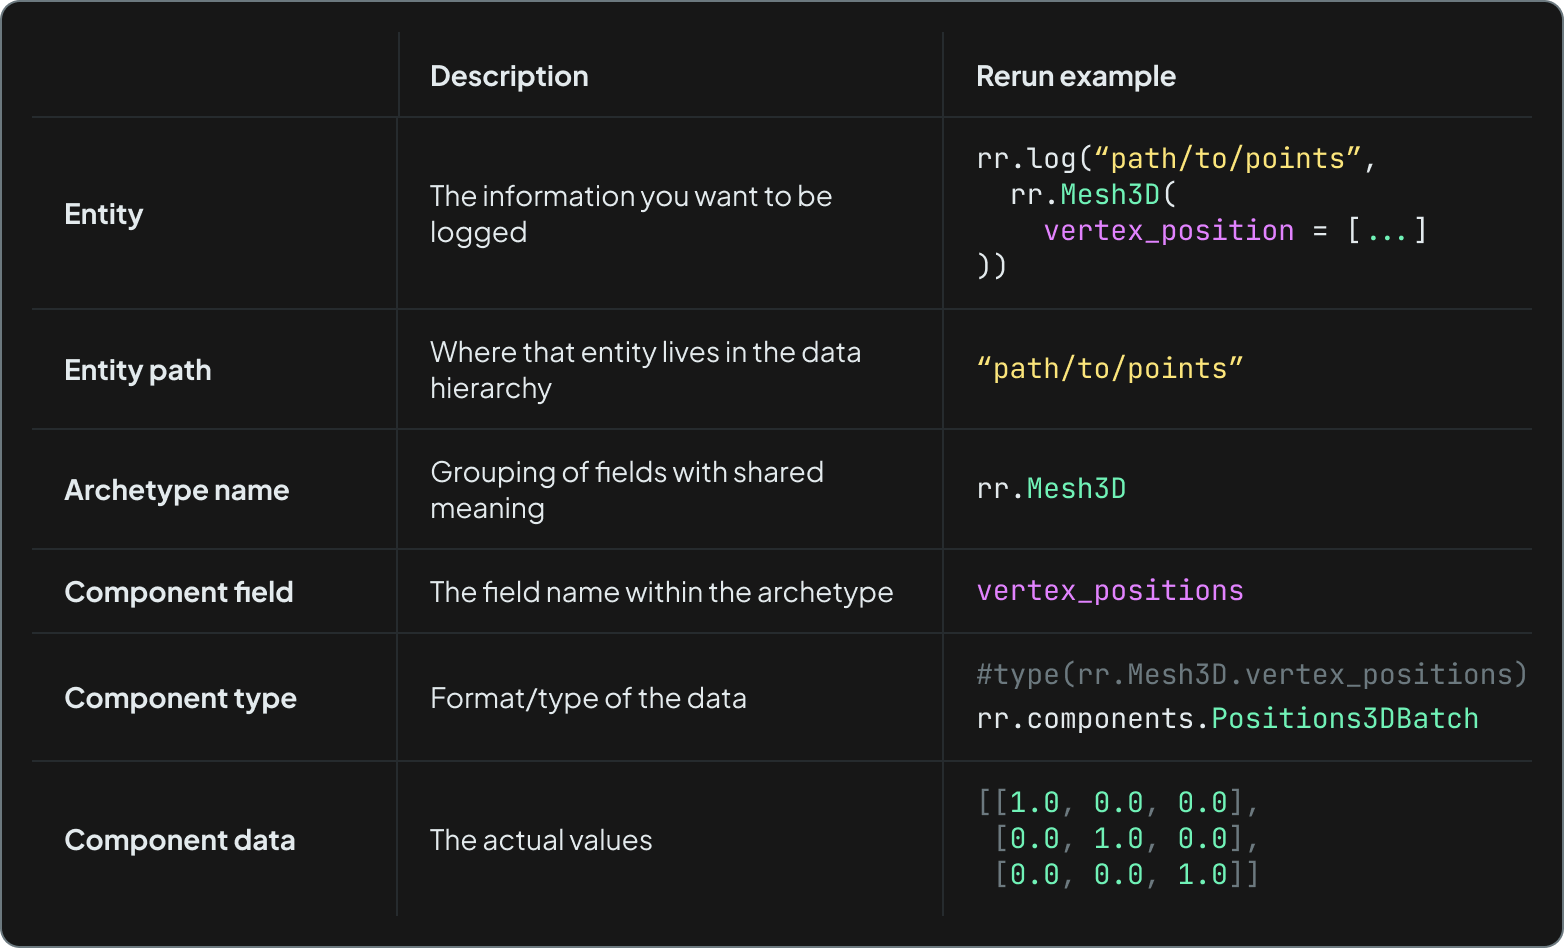
Each component is now uniquely specified by its entity path and component identifier (archetype name and component field name). In case you’re not already familiar with our Entity Component System, here’s a helpful chart to recap:
For components built into Rerun, table views use the component identifier (<archetype name>:<component field name>) as column headers:

This richer context is found all throughout the UI now: in the streams panel, the selection panel, and hover menus. Notice the dropping of the AnnotationContextIndicator , the grouping by archetype, and the use of component field names instead of component types.

Additionally, logging custom values can become more descriptive by using the new ComponentDescriptor class to tag your components with built-in types:
import rerun as rr

rr.log(
    "any_values",
    rr.AnyValues(
        # Using arbitrary data that can be converted to Arrow
        homepage="https://www.rerun.io",
        repository="https://github.com/rerun-io/rerun",
    )
    # Or, using Rerun's built-in components
    .with_field(
        rr.ComponentDescriptor("confidence", component_type=rr.components.ScalarBatch._COMPONENT_TYPE), [1.2, 3.4, 5.6]
    )
    .with_field(
        rr.ComponentDescriptor("description", component_type=rr.components.TextBatch._COMPONENT_TYPE), "Bla bla bla…"
    ),
)
Here’s an example of how this component information appears on hover in the selection panel using our air traffic data example:

Where we’ll go from here where-well-go-from-here
In the future we'll allow you to reinterpret components live in the viewer by overriding the tags. For example, a 3D transform can be reinterpreted as an array of scalars and plotted in a time series to view changes over time. In these cases, you will be able to a component's identifier and tags to dynamically shift how it appears across different visualizers — without needing to modify the underlying data.
Since most of the foundational work was done in previous releases, no major breaking API changes have been made to the standard logging functions. Visit the Tagged Components GitHub issue to see the full history of development over the past year.
And more! and-more
Plus a lot of UI tweaks, bug fixes, and performance improvements. Review all of the changes in Rerun 0.24 at our changelog.